
|
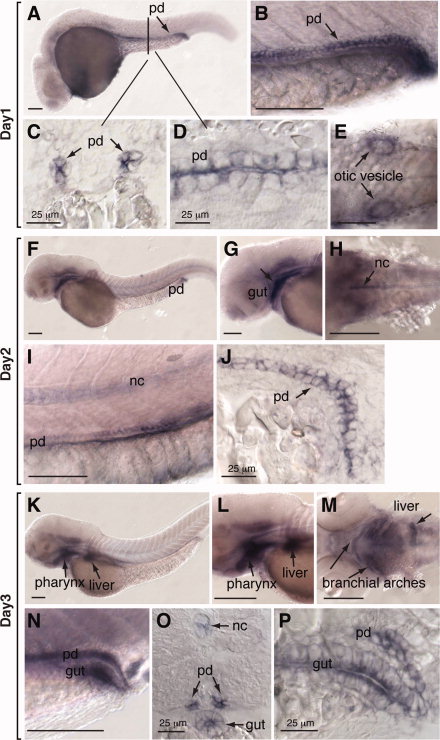
Fig. 5 Expression of par2b in embryos at 1–3 days postfertilization (dpf), as detected by whole-mount in situ hybridization. A–E: At 1 dpf. A: Lateral view. B: High-magnification view of the trunk region of A. C,D: Transverse and sagittal sections, respectively, of the trunk area indicated by the black line shown in A, with black arrows denoting par2b expression in the pronephric duct (pd). Note that par2b is highly expressed on the apical side of the epithelial cells of the pronephric duct. E: Dorsal view of anterior region in A, showing par2b expression in the otic vesicle. F–J: At 2 dpf. F: Lateral view. G,H: Lateral and dorsal views, respectively, of the anterior region of F at high magnification, showing par2b expression in the gut and notochord (nc). I:Lateral view of the trunk region of F at high magnification, showing par2b expression in the gut and notochord. J: Sagittal section of the trunk area. K–P: At 3 dpf. K,L: Lateral view, arrows denote pharynx and liver. M: Ventral view, showing par2b expression in branchial arches and the liver. N: Lateral view of the trunk region at high magnification, showing par2b expression in the gut and pronephric duct (pd). O,P: Transverse (O) and sagittal (P) sections of the trunk area. Note that par2b transcript was enriched on the apical side of the epithelial cells of both the pronephric duct and gut. Scale bars = 100 μm unless specifically labeled.