
|
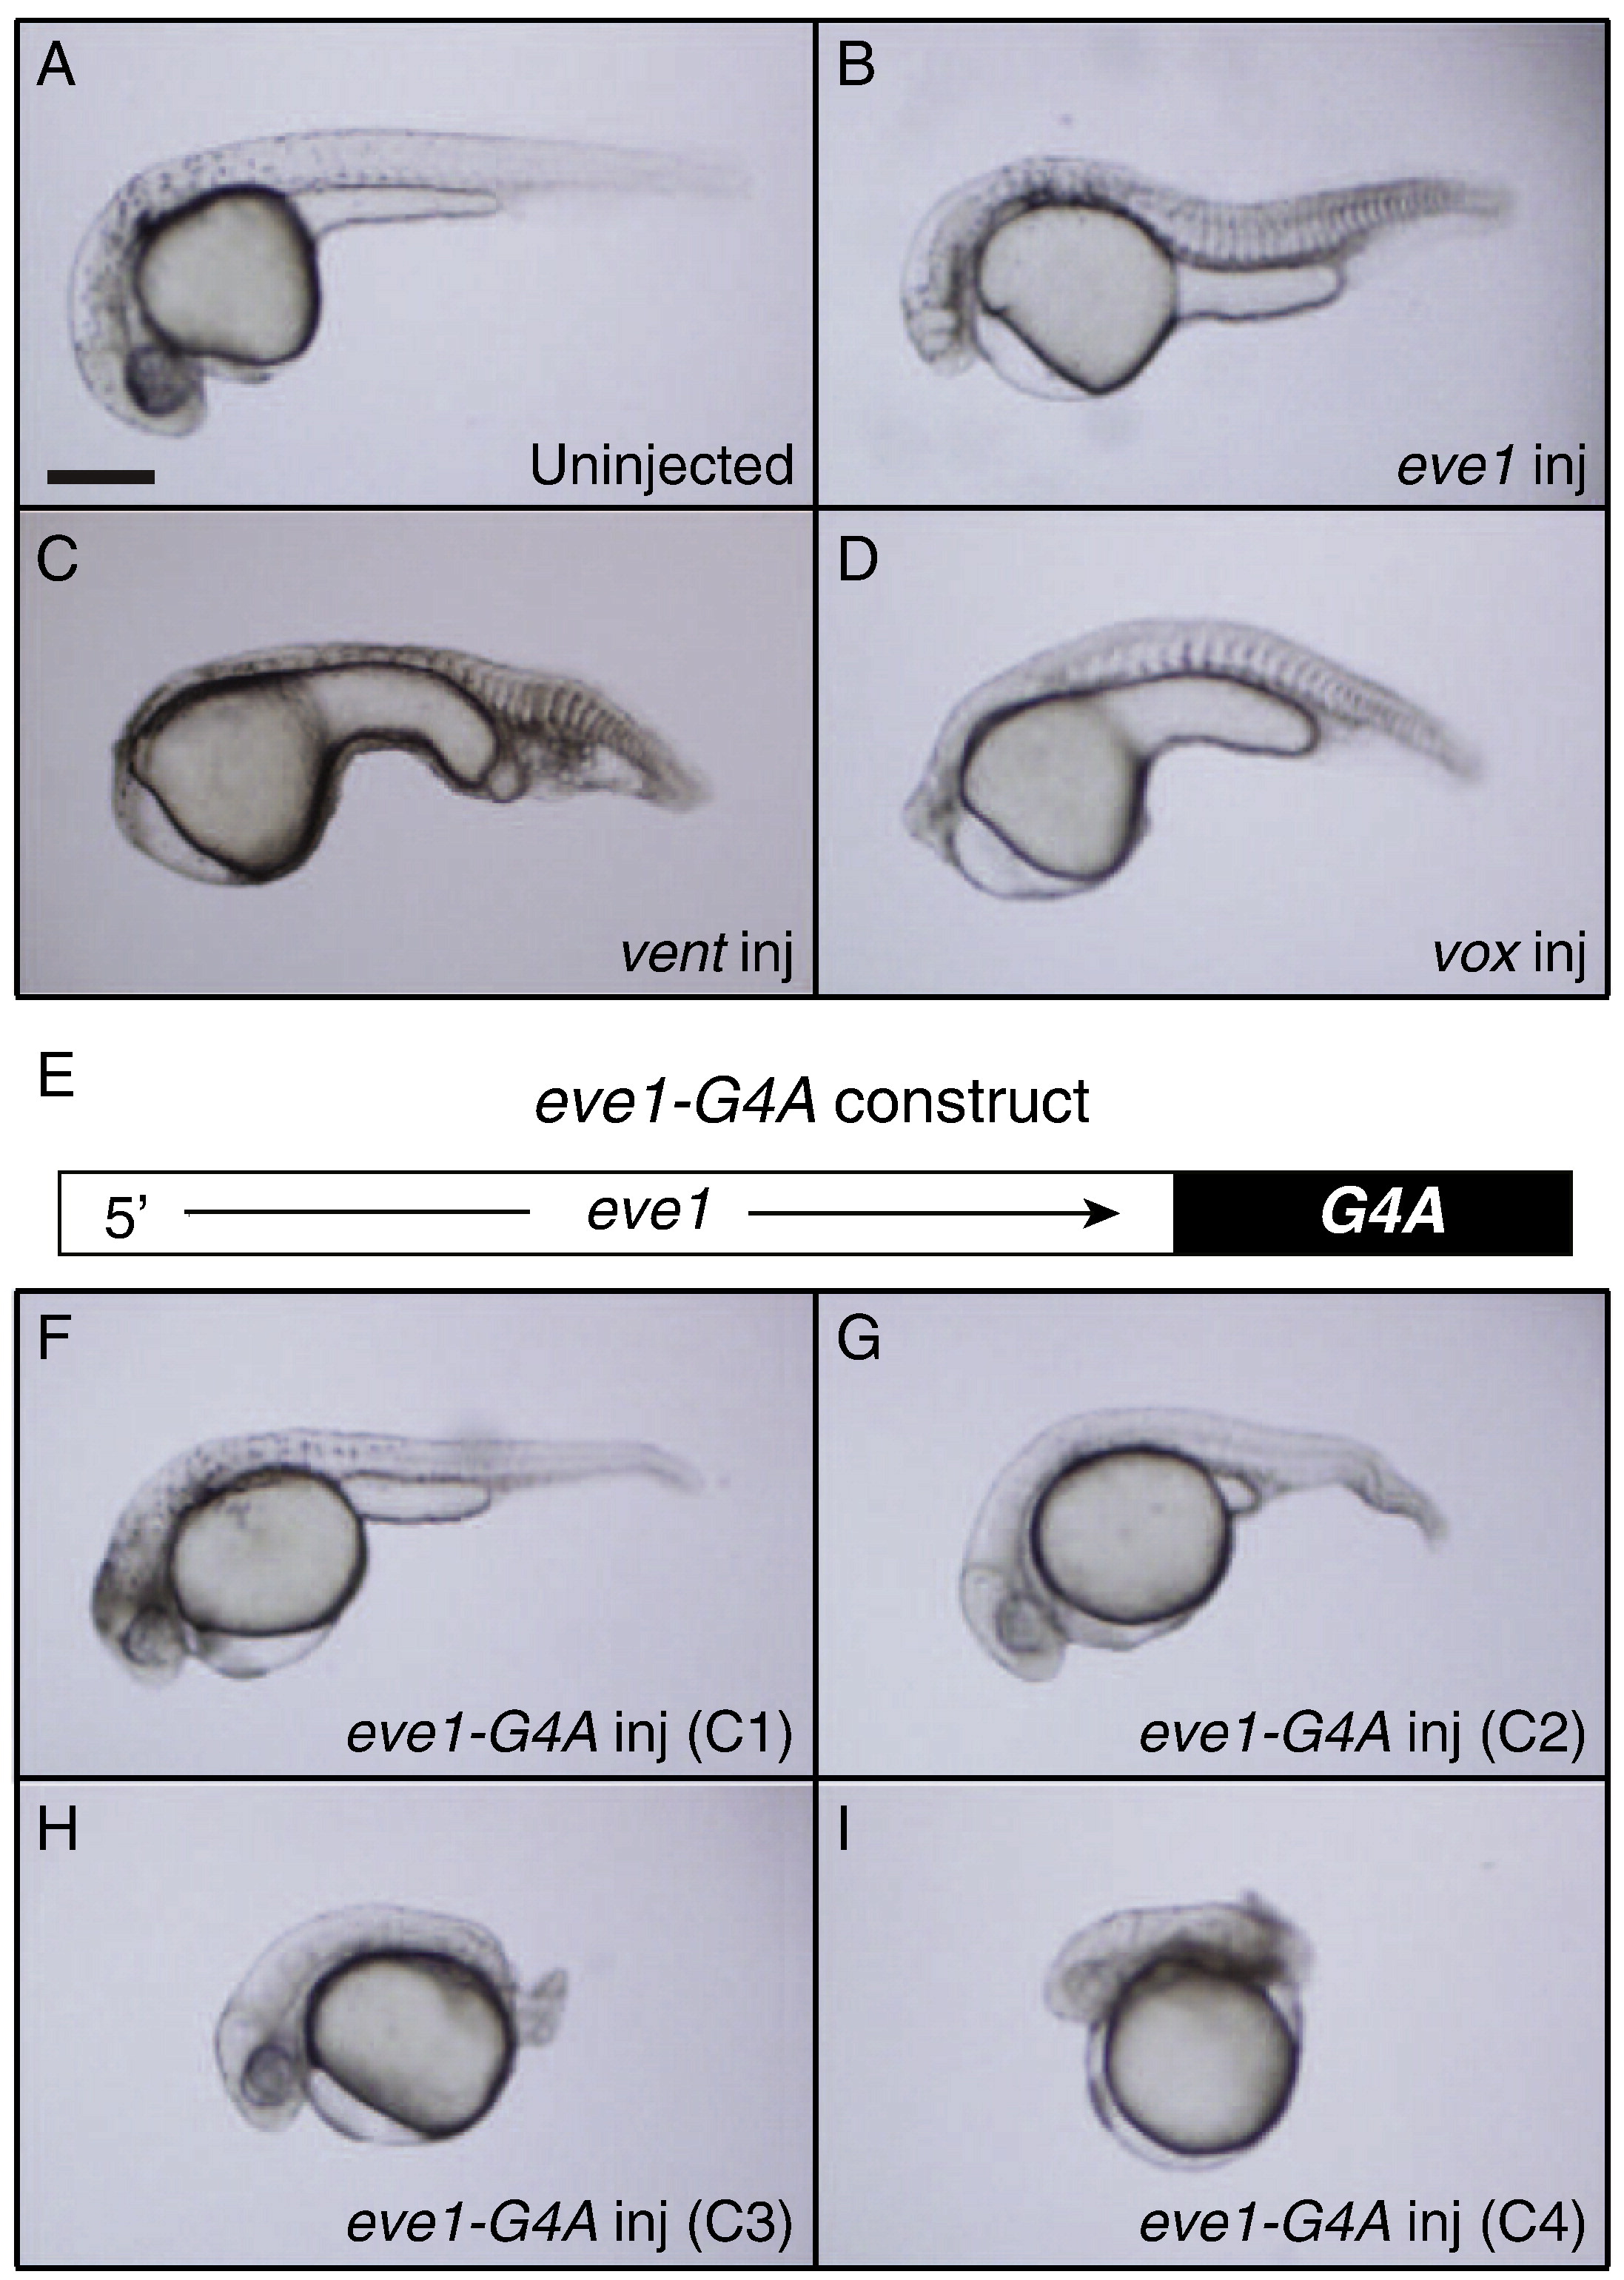
Fig. 1 Morphological phenotype comparison between zebrafish embryos overexpressing eve1, vent, vox and eve1-G4A. A–D) Lateral views of embryos at 24 h post fertilization (hpf) with anterior to the left. A) Uninjected (n = 30), B) Injected with 90 pg of eve1 mRNA (n = 66), C) Injected with 75 pg of vent mRNA (n = 58) and D) Injected with 75 pg of vox mRNA (n = 72). E) Schematic depiction of eve1-G4A construct. F–I) Lateral views of embryos injected with 100 pg of eve1-G4A at 24 hpf with anterior to the left, showing a range of dorsalized phenotypes F) C1 (n = 1/43), G) C2 (n = 16/43), H) C3 (n = 19/43) and I) C4 (n = 7/43). Scale bar, 200 μm.
Reprinted from Developmental Biology, 349(1), Seebald, J.L., and Szeto, D.P., Zebrafish eve1 regulates the lateral and ventral fates of mesodermal progenitor cells at the onset of gastrulation, 78-89, Copyright (2011) with permission from Elsevier. Full text @ Dev. Biol.