
|
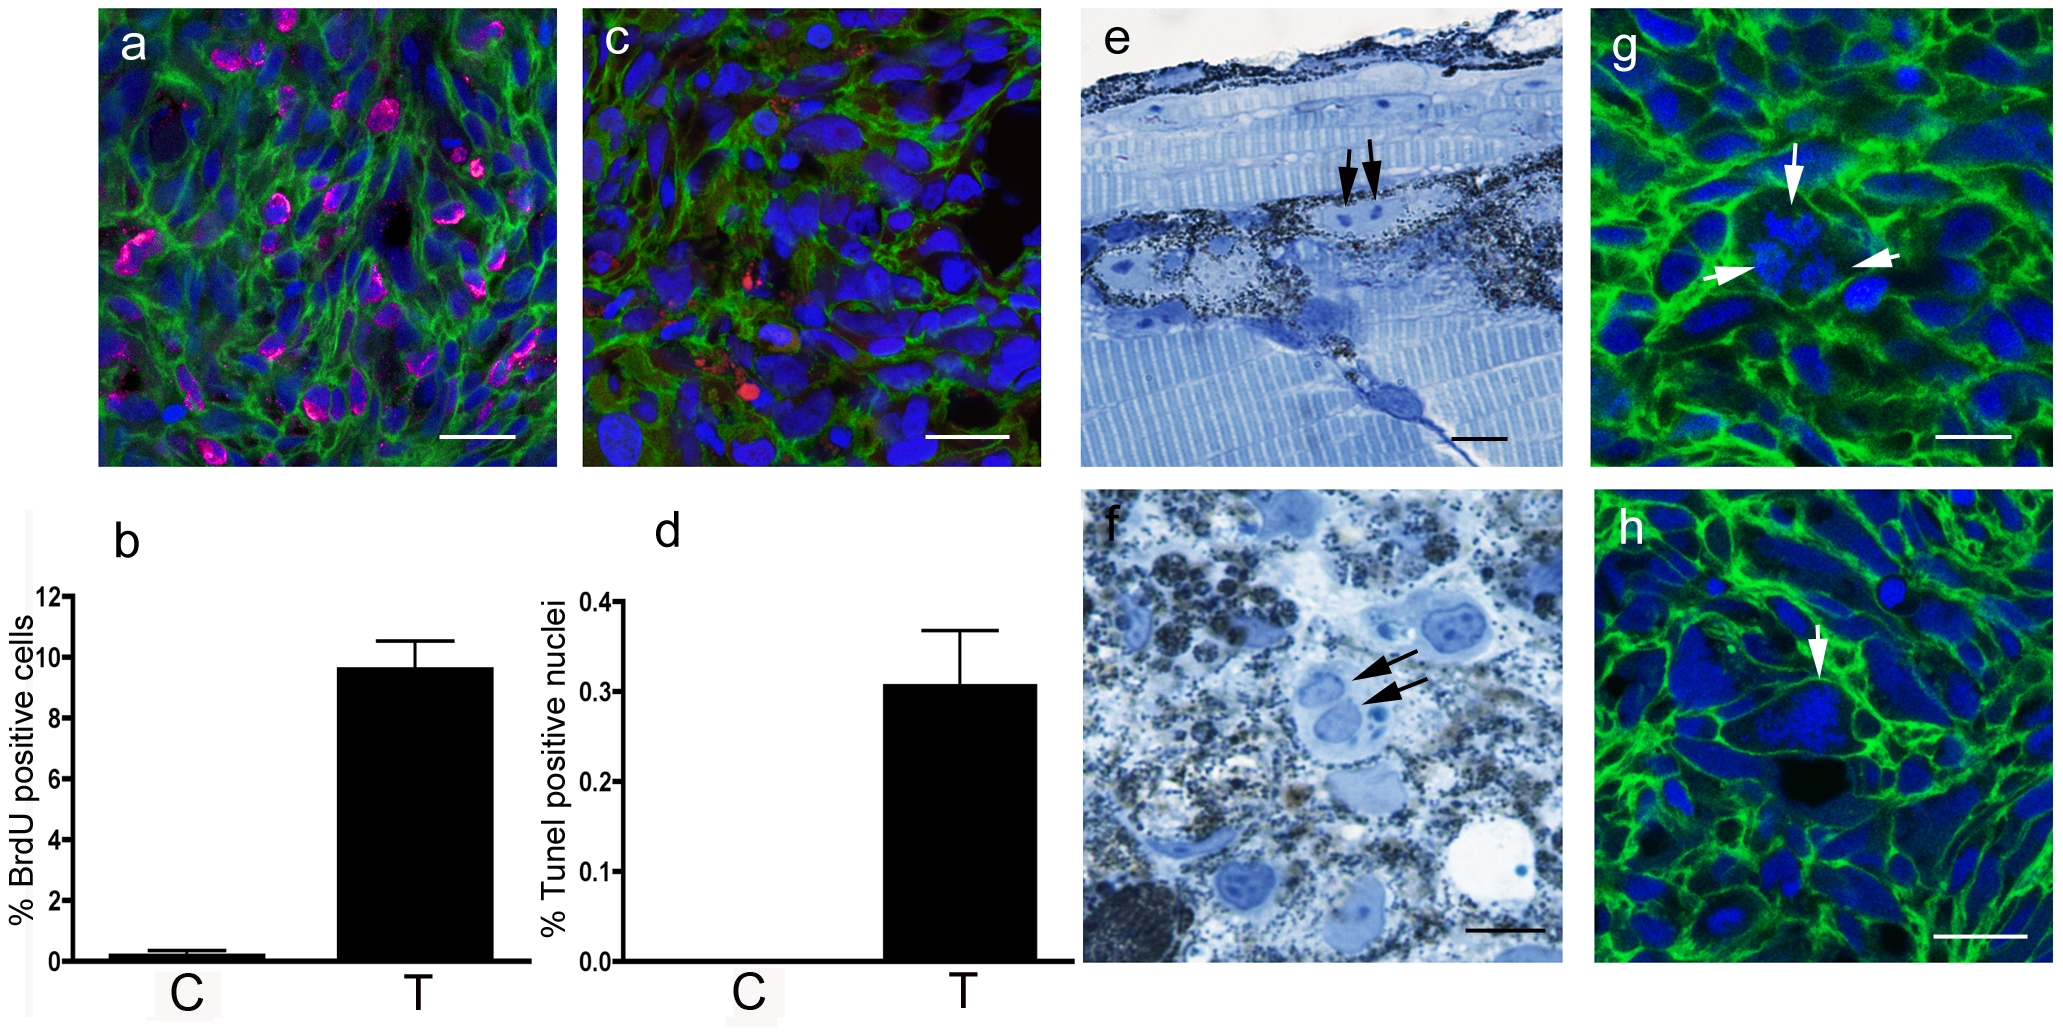
Fig. 4 Histology of kita-GFP-Ras melanoma.
a) BrdU+ nuclei (magenta) in a section of a melanoma developing in a 3-month-old kita-GFP-RAS fish. b) Diagram showing percentage of BrdU+ cells in control skin (C) and melanoma (T) sections (n = 5). c) TUNEL+ nuclei (red) in a cryostat section of a melanoma developing in a 3-month-old kita-GFP-RAS fish. d) Diagram showing percentage of TUNEL+ cells in control skin (C) and melanoma (T) sections (n = 5). e) Semithin (0.5 μm thick) resin section of a 5dpf kita-GFP-RAS larva, showing several melanocytes, one of which is at the end of mitosis. Arrows point to the two chromosomal condensations. f) Semithin section of a tumor from a 3-month-old kita-GFP-RAS fish showing enrichment in melanocytes one of which is binucleate (arrows). g–h) Cryostat sections of melanomas developing in kita-GFP-RAS 3-month-old fish. All cells express GFP-RAS (green at the plasma membrane) and have DAPI (blue) counterstained nuclei. Arrows point to a multipolar spindle (g) and a polyploid giant nucleus with condensed chromosomes (h). Calibration bars: 50 μm.