
Image
|
Figure Caption
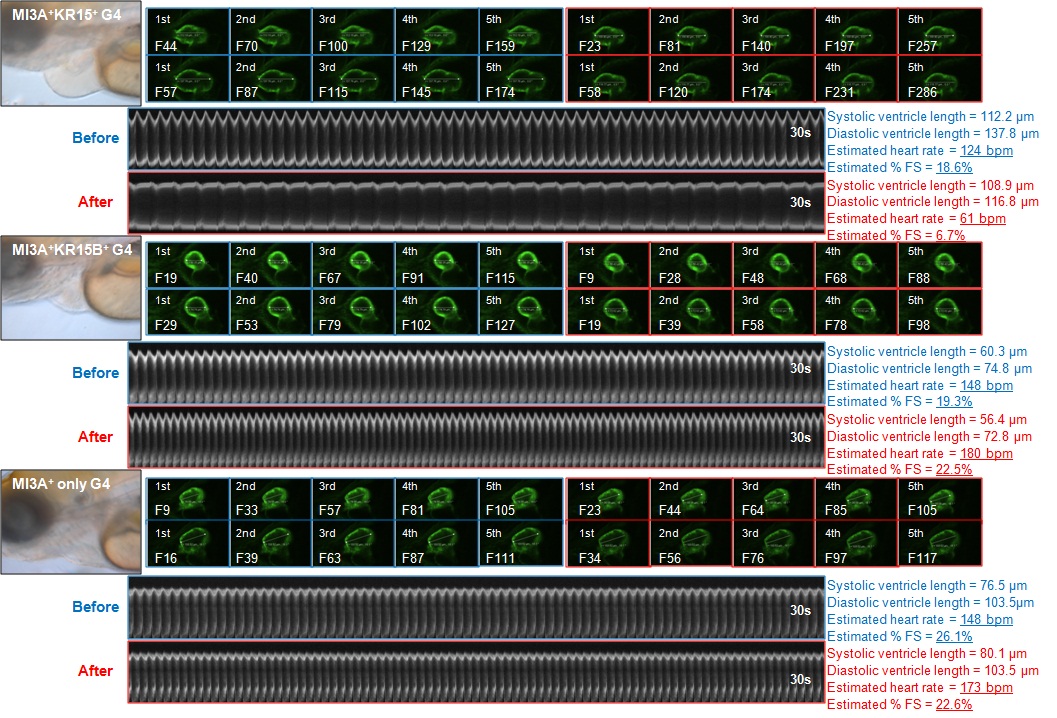
Fig. S7 Fourth group of images used to generate the bar chart of percent change in heartbeat and contractility after illumination. Heart beat and contractility in SqKR15/ET33-mi3A (sample), SqKR15B/ET33-mi3A (skin control) and KR-negative Sq ET33-mi3A (negative control) 3dpf larvae before and 20 min after illumination.
Acknowledgments
This image is the copyrighted work of the attributed author or publisher, and
ZFIN has permission only to display this image to its users.
Additional permissions should be obtained from the applicable author or publisher of the image.
Full text @ BMC Dev. Biol.