
|
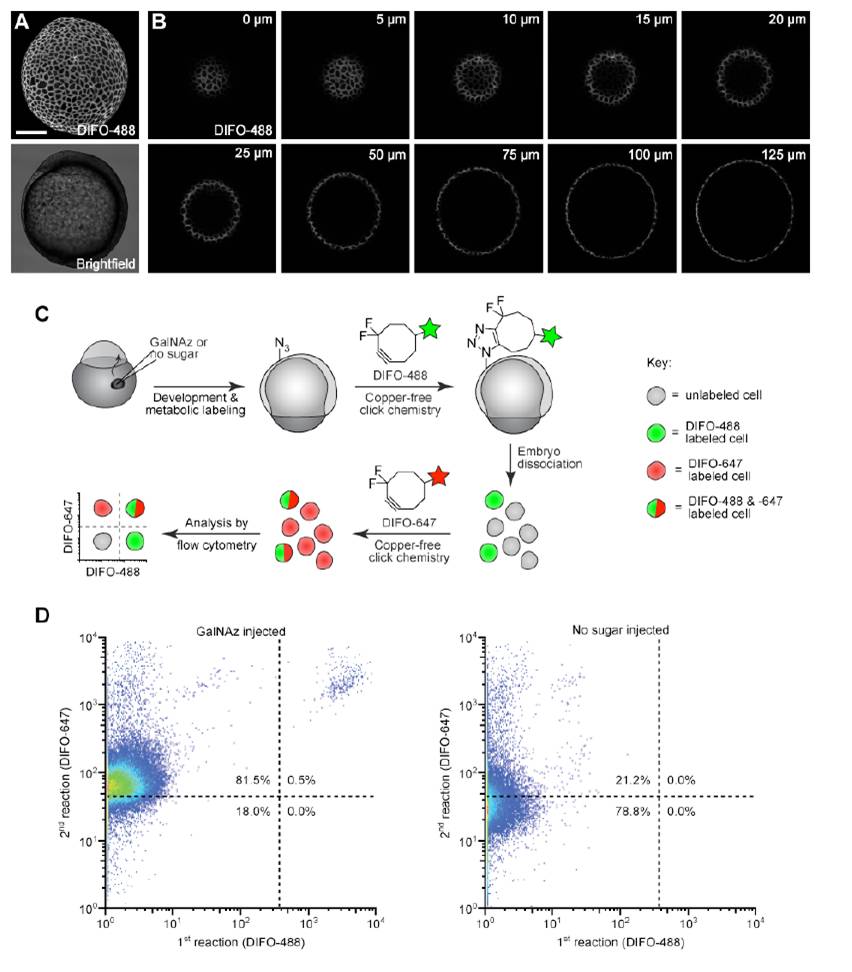
Fig. S7 Distribution of GalNAz- and DIFO-488-labeled cells from 10 hpf embryos. Zebrafish embryos were microinjected with 25 pmol of GalNAz, allowed to develop to 10 hpf, and then reacted with DIFO-488 (100 μM, 1 h). (A) Maximum intensity z-projection fluorescence image and corresponding brightfield image. (B) Several individual z-planes from the z-projection shown in (A), demonstrating labeling of the surface cells. Distances indicated are in the z direction from the top of the embryo. (C) Schematic of dual-labeling flow experiment. Following microinjection with GalNAz and reaction with DIFO-488, embryos were dissociated, and the resulting cell suspension was labeled with DIFO-647 (100 μM, 30 min) and then analyzed by flow cytometry. (D) Representative dot plots of cells from embryos injected with GalNAz (left) or no sugar (right). In GalNAz-injected embryos, most of the cells displayed DIFO-647-derived signal, indicating that most cells of the embryo were metabolically labeled with GalNAz. Approximately 0.5% of cells were also labeled with DIFO-488, indicating that these cells were accessible to this reagent while part of the intact embryo. Scale bar: 200 μm.