
|
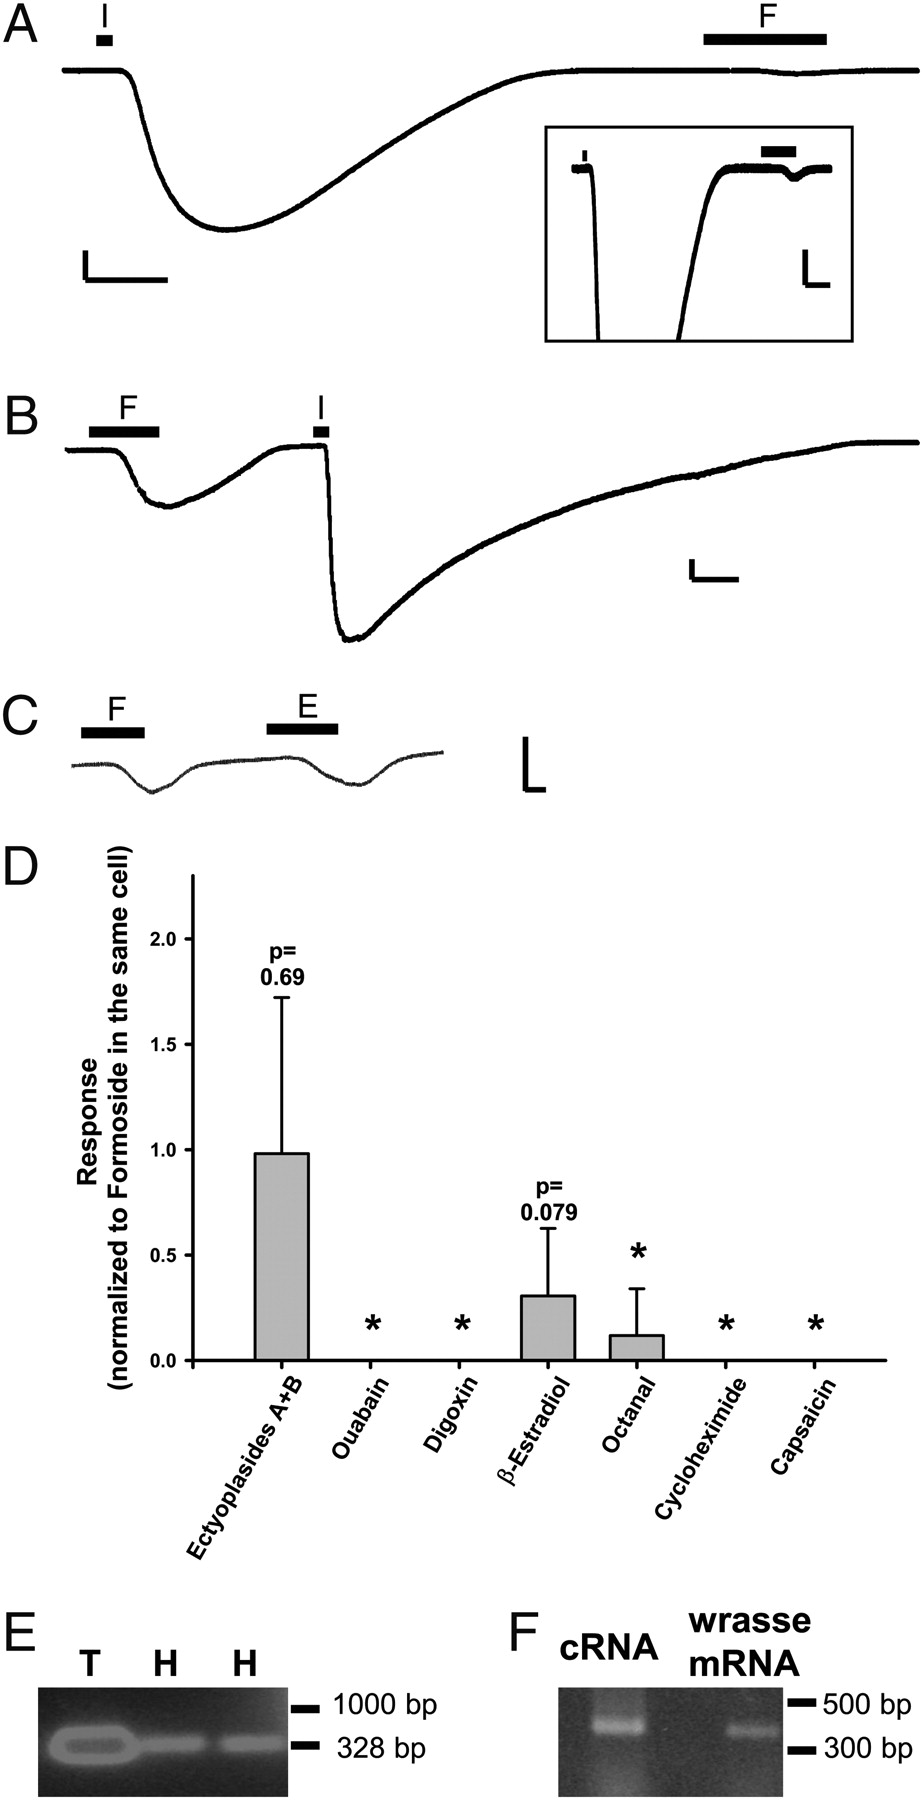
Fig. 1
Identification and initial characterization of clone encoding a coreceptor for aversive compounds. (A and B) Traces in response to 1 μM isoproterenol (I) or 5 μM formoside (F) from oocytes coexpressing CFTR, β2AR, and either cDNA library fraction A (n = 10; formoside response range, 0.05–0.2 μA) (A) or isolated full-length clone A9-f4-230 (n > 40; range, 0.1–3.7 μA) (B) (Scale bars: A, 0.5 μA, 2 min; A, Inset, 0.2 μA, 2 min; B, 0.5 μA, 2 min.) The inset in A shows a view of the same trace expanded in the amplitude dimension. (C and D) Electrophysiological responses to various compounds in oocytes expressing CFTR, β2AR, and the full-length clone. (C) A mixture of ectyoplasides A and B (E) caused a response comparable to a formoside-induced response (n = 5; range, 0.1–0.4 μA) (Scale bar: 0.5 μA, 1 min.) (D) The ligand specificity of RL-TGR was investigated by exposing formoside-responsive oocytes to a variety of other compounds, including ectyoplasides A and B (10 μM), ouabain (5 μM), digoxin (5 μM), 17β-estradiol (5 μM), octanal (0.5 mM), cycloheximide (1.5 μM), and capsaicin (50 μM). Responses to these ligands were normalized to the response to 5 μM formoside in the same cell (n = 3–10). Error bars represent SD. *P < 0.05 compared with formoside in the same cell. (E) RT-PCR analysis of zebrafish tissues identified transcript in the head (H) and trunk (T). (F) RT-PCR analysis of bluehead wrasse head tissue.