
|
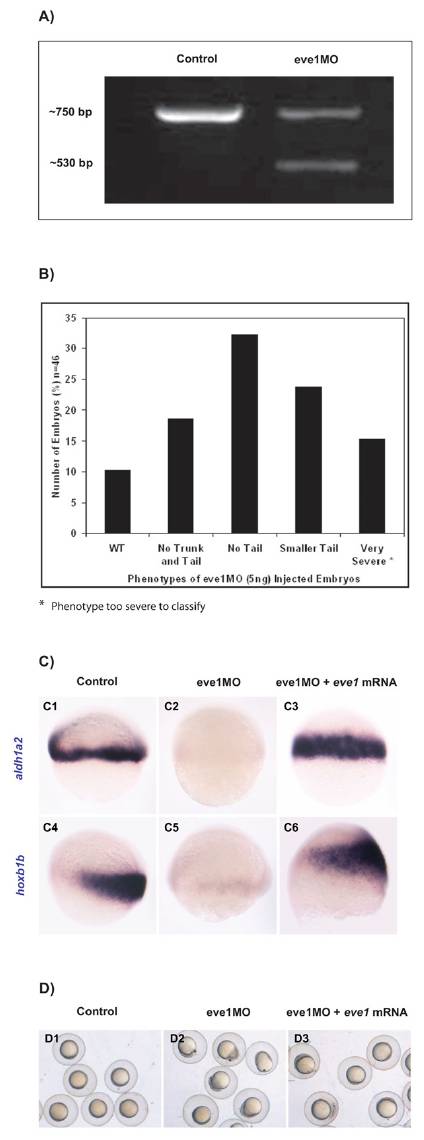
Fig. S1 Eve1MO phenotypic classes and specificity of eve1MO. (A) PCR of eve1 transcripts in uninjected and eve1MO-injected embryos. Note the two bands in the eve1MO lane compared with the single band in control embryos, which corresponds to the correct size for eve1 mature mRNA. Sizes are indicated to the left. (B) Range of phenotypes observed in eve1MO-injected embryos. (C) Eve1 mRNA injection rescues the eve1MO-mediated suppression of aldh1a2 (C3) and of hoxb1b (C6), indicating that the MO is specific. (D) Eve1 mRNA injection rescues eve1MO-induced epiboly defects; photographs were taken when control embryos reached 80% epiboly.