
|
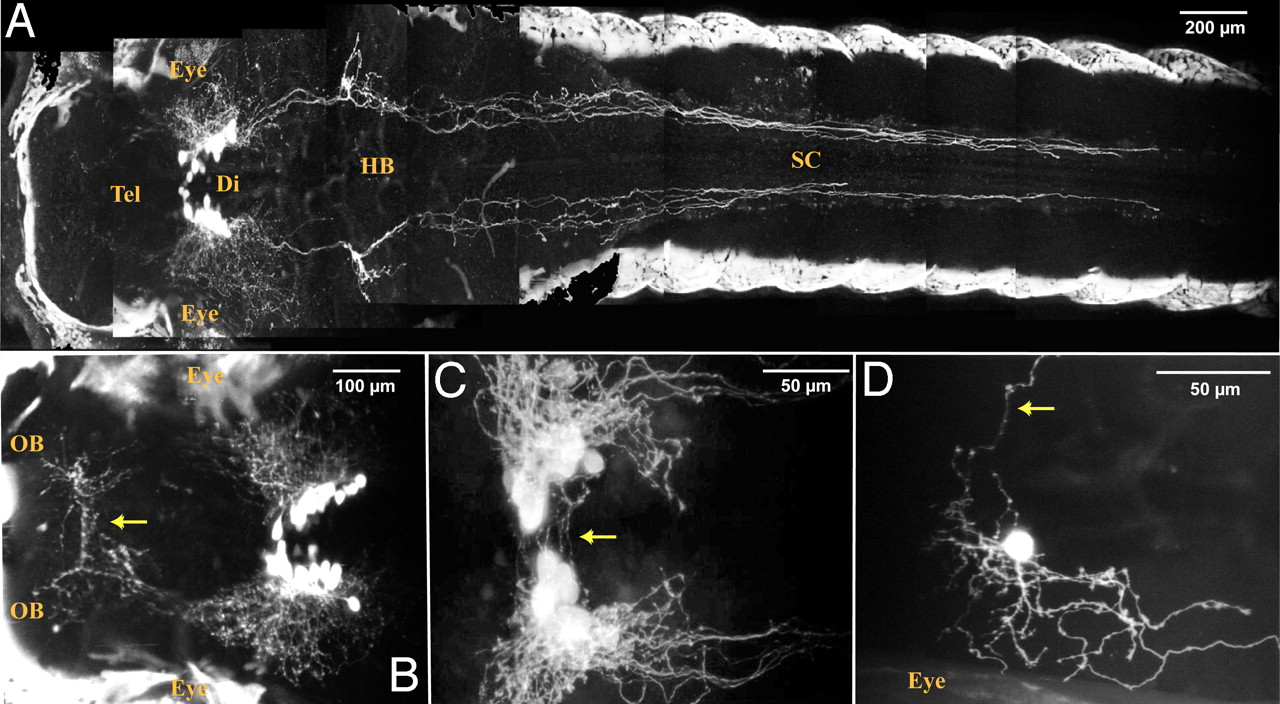
Fig. 2
A stable hcrt:EGFP transgenic line reveals the entire HCRT circuit of a living larva. (A–C) Two-photon imaging of a 7dpf stable transgenic larva with head to the left, dorsal views. (A and close-up B) Composite picture showing the HCRT cell bodies in the diencephalon (Di) and their processes in the hindbrain (HB) and spinal cord (SC) and in the telencephalon (Tel) directed toward the olfactory bulbs (OB). In A and B, white areas on both sides of the larva correspond to skin autofluorescence. Commissural projections are observed ventrally to the HCRT cell body clusters (C, arrow) and in the anterior telencephalon (B, arrow, commissura anterior). (D) Mosaic expression of a nonintegrated hcrt:EGFP transgene allowing the observation of a single HCRT neuron harboring both commissural (arrow) and ipsilateral processes.