
Fig. 4
- ID
- ZDB-IMAGE-101118-30
- Antibodies
- Publication
- Song et al., 2010 - Neural and Synaptic Defects in slytherin, a Zebrafish Model for Human Congenital Disorders of Glycosylation
- All Figures
- Figures for Song et al., 2010
|
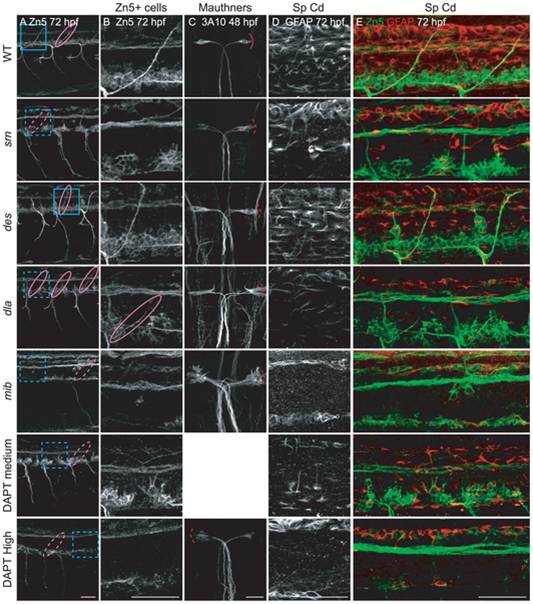
Fig. 4 A, B. Secondary motor neuron cell body number and patterning assayed with Zn5 immunostaining (18 embryos/3 carrier pairs for each). B. Higher magnification of boxed region in A. At 48–72 hpf, Zn5+ cell number is similar in srn and WT (Fig. S4), but the patterning of these cells is aberrant in srn embryos. Zn5+ cells are clumped in srn mutants (dashed blue bracket) compared to WT embryos (solid blue bracket). dla mutants do not have defects in Zn5+ cell number (Fig. S4), but have aberrant Zn5+ cell patterning as in srn mutants (dashed blue bracket). mib mutants and high dose DAPT treated embryos have aberrant Zn5+ cell number (Fig. S4) and patterning (dashed blue bracket). Medium dose DAPT treated embryos show aberrant Zn5+ cell patterning defects (dashed blue bracket), without an obvious change in cell number (Fig. S4), as in srn. The dorsal projecting nerve is absent in srn mutants (dashed pink oval) compared to WT (solid pink oval), consistent with increased cell death; this nerve is present in dla and des mutants (solid pink oval); des also has other motor axon pathfinding errors. In mib mutants and high and medium dose DAPT treated embryos, the dorsal projecting nerve is absent (dashed pink oval). C. In WT embryos at 48 hpf, two Mauthner neurons are present (dorsal view of hindbrain). In srn, des, dla, mib and high dose DAPT treated embryos, Mauthner neuron number is increased (dashed red brackets), with the largest increase observed in mib (12 embryos, 3 carrier pairs for each). D. In the spinal cord, the number of GFAP+ glial cells is reduced in srn and dla mutants and medium dose DAPT treated embryos compared to WT and des embryos at 48–72 hpf. In mib and high dose DAPT treated embryos, a more dramatic reduction is observed. The GFAP labeling that remains in mib mutants is likely to be in Rohon-Beard neurons dorsally and secondary motor neurons ventrally and is easily separated morphologically and based on its location from glial processes, thus does not interfere with analyses of glial defects (18 embryos, 3 carrier pairs for each). E. Overlay showing both the Zn5 and GFAP staining in the spinal cord. Scale bars = 40 μm.