
|
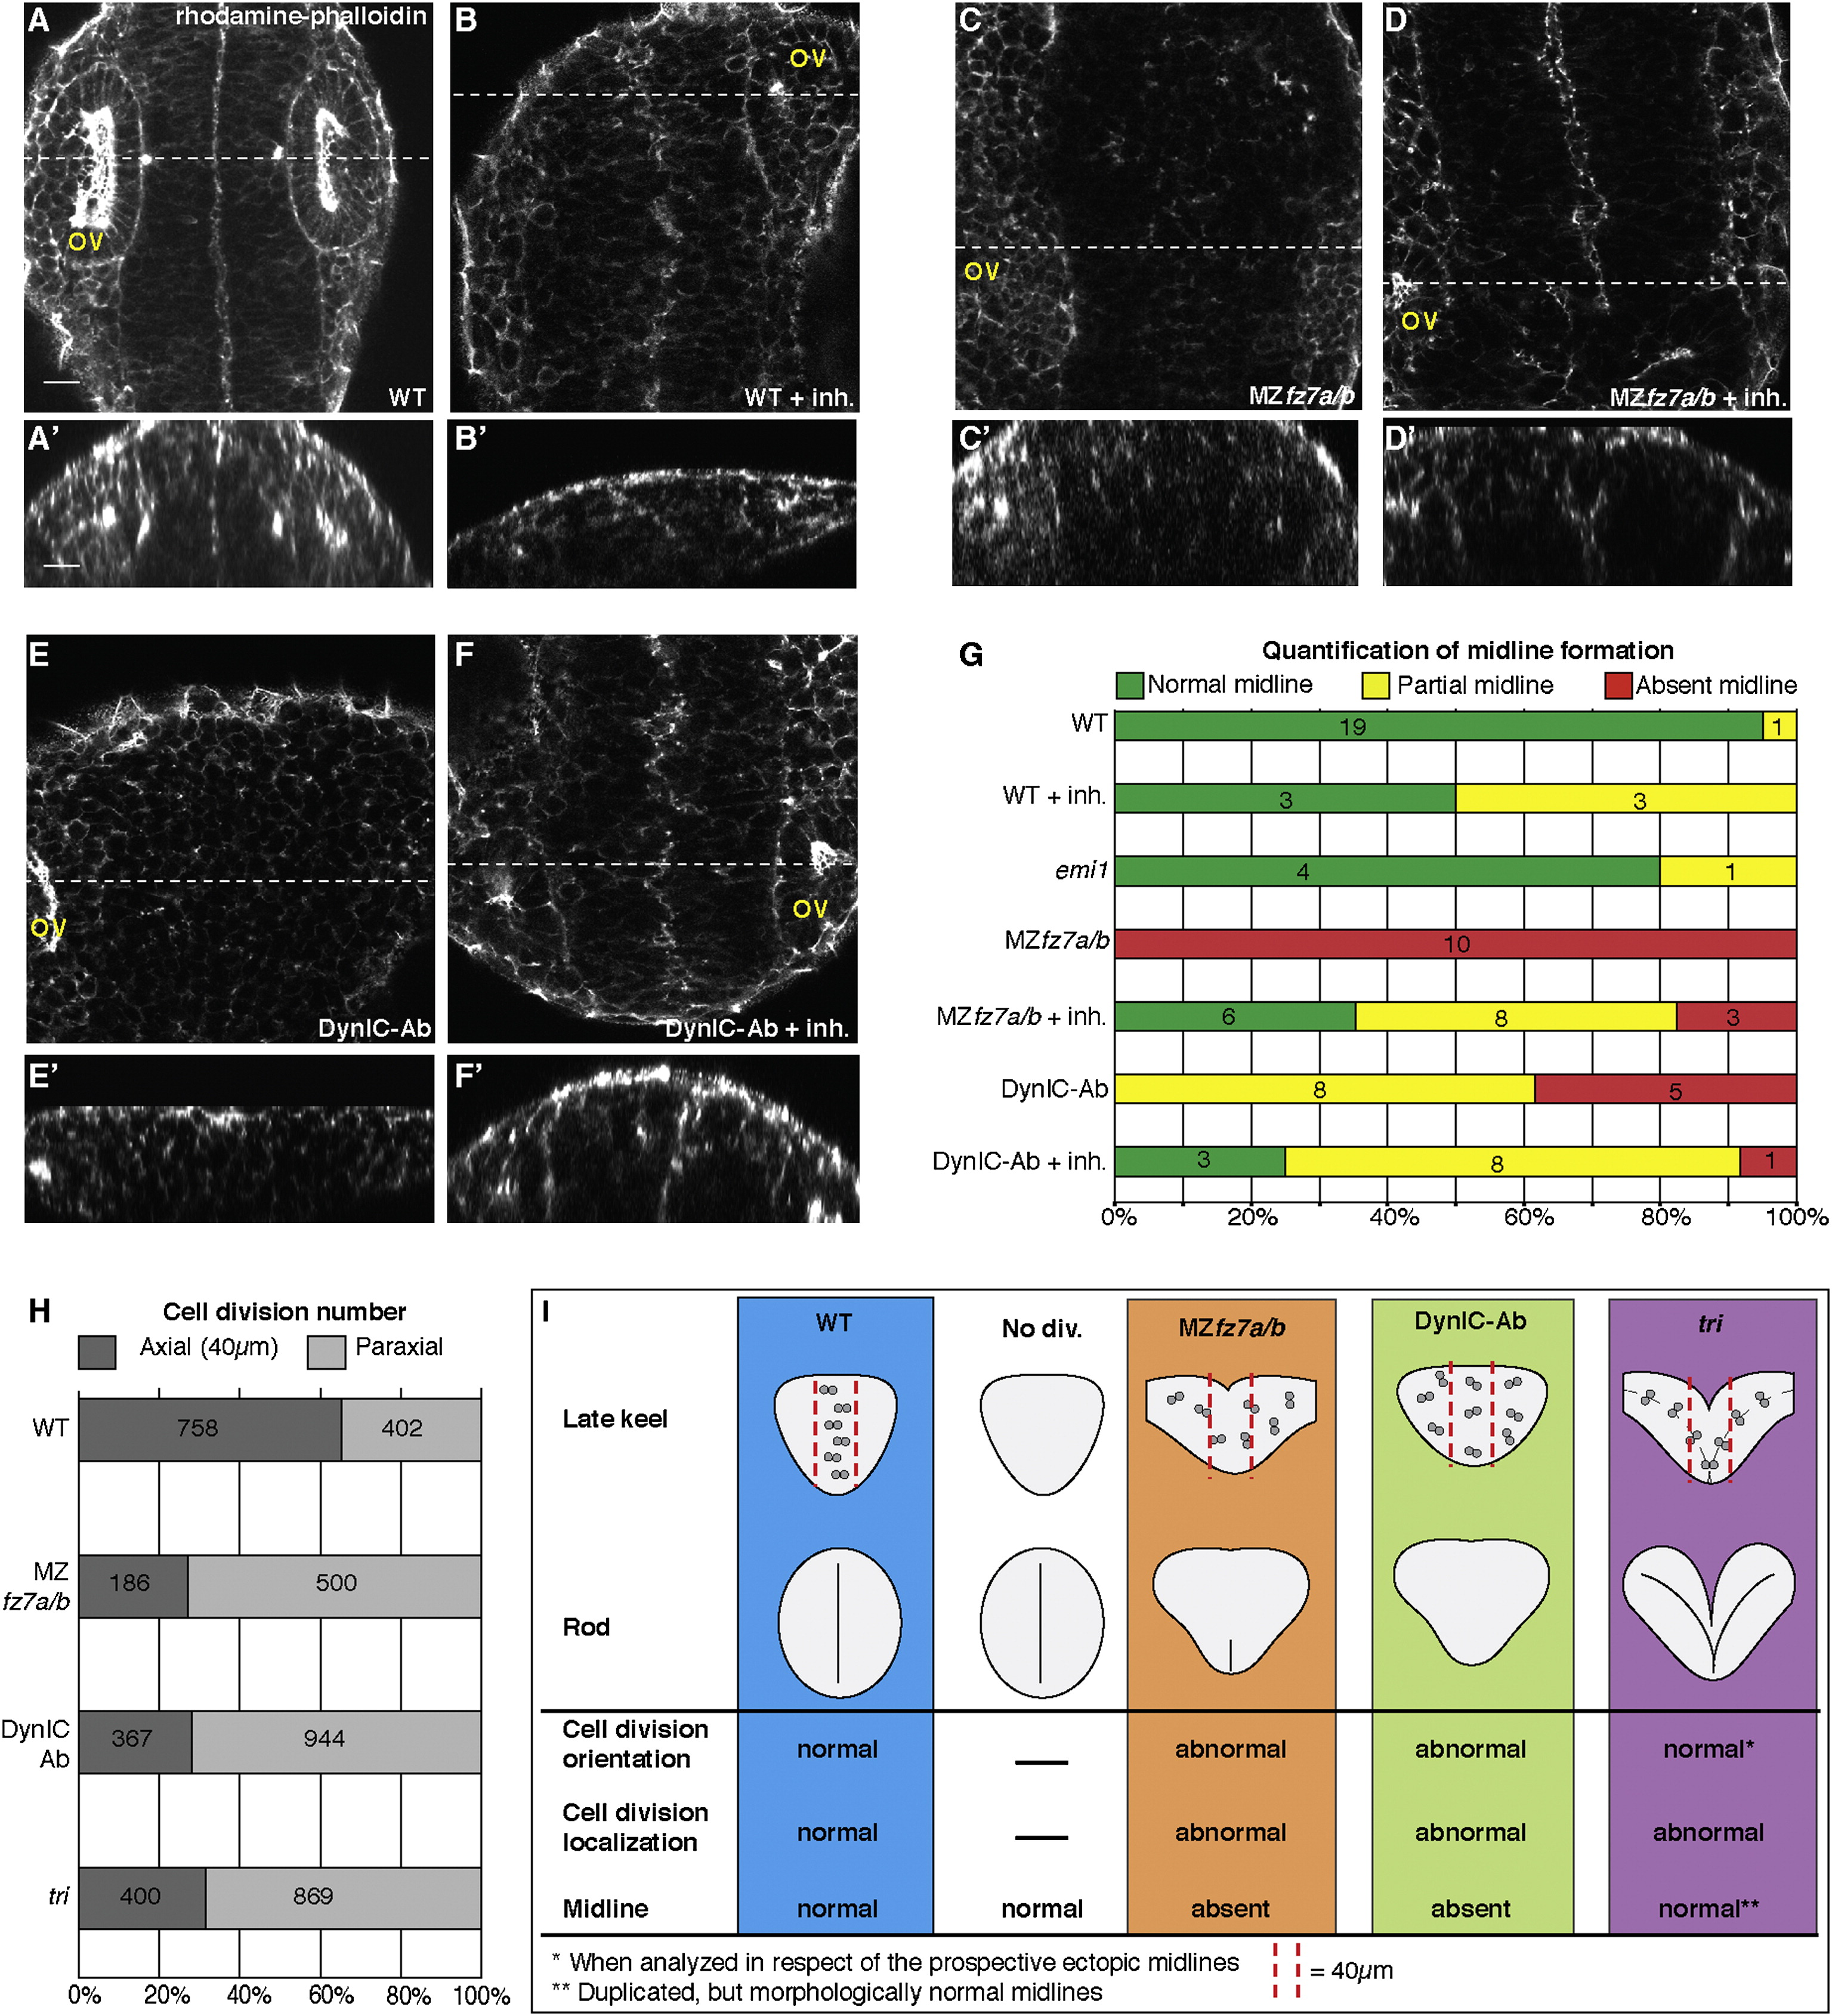
Fig. 4 Stereotypical Neural Progenitor Cell Division Orientation Is Required for Neural Rod Midline Formation during Neurulation
(A–F′) Micrographs of F-actin distribution in dorsal (A–F) and transversal (A′–F′) confocal sections of Rhodamine-Phalloidin-stained neural rods in wild-type (A and A2), wild-type treated with cell-division inhibitors (B and B′), MZfz7a/b mutants (C and C′), MZfz7a/b mutants treated with cell-division inhibitors (D and D′), DynIC-Ab-injected embryos (E and E′), and DynIC-Ab-injected embryos treated with cell-division inhibitors (F and F′) at the 16-somite-stage (15 hpf). OV= otic vesicle; dashed lines in (A–F) demarcate the place of the transversal sections in (A′–F′). Scale bars represent 20 μm.
(G) Quantification of neural rod midline formation in wild-type embryos, wild-type embryos treated with cell-division inhibitors, emi1 embryos, MZfz7a/b mutants, MZfz7a/b mutants treated with cell-division inhibitors, DynIC-Ab-injected embryos, and DynIC-Ab-injected embryos treated with cell-division inhibitors.
(H) Number of cell divisions in axial and paraxial regions of wild-type, MZfz7a/b, DynIC-Ab injected, and tri embryos during neurulation (13–16 hpf)
(I) Schematic representations of the neural rod (transverse section), summarizing the effects on neural progenitor cell division localization and orientation and on neural rod midline formation in the different experimental conditions analyzed in this study.
See also Table S1.