
|
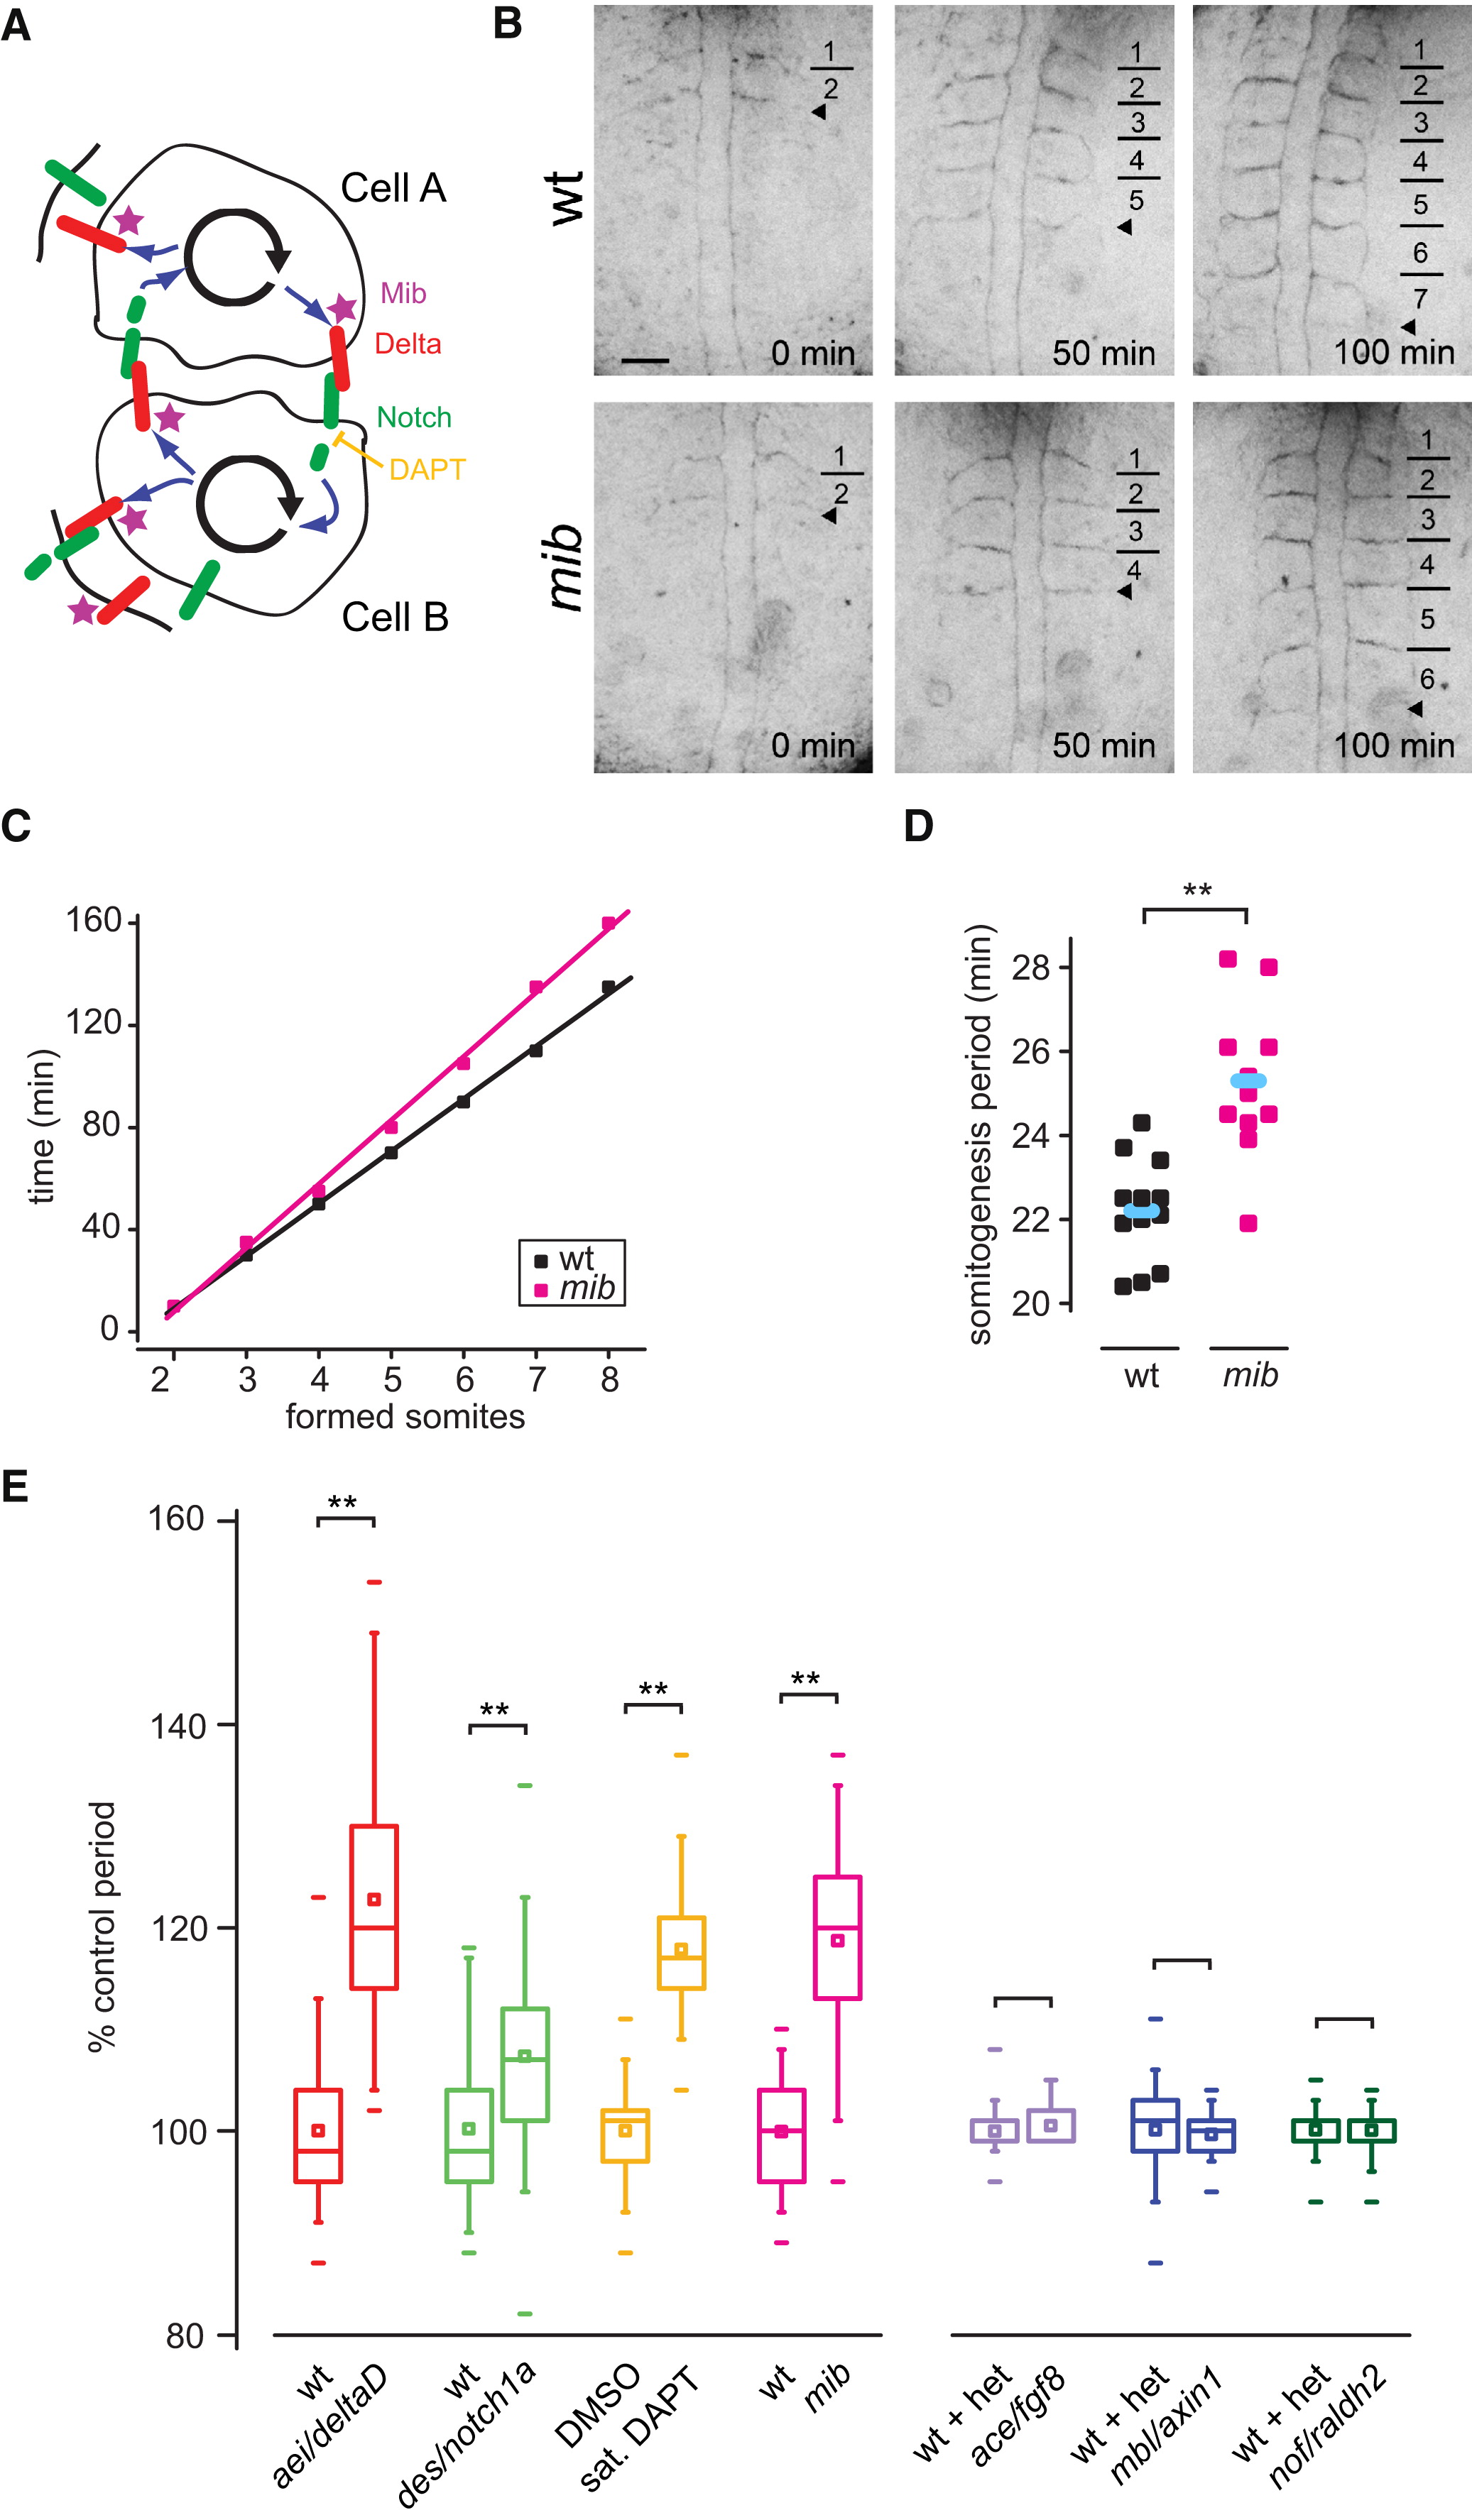
Fig. 2 Somitogenesis Period Increases after Reduction in Delta-Notch Coupling
(A) Delta-Notch coupling between two oscillating PSM cells. Delta is the ligand for the Notch receptor, which can be inhibited via the small molecule DAPT. Mib is a ubiquitin ligase required for Delta trafficking and activation.
(B) Time-lapse movies of wild-type (wt) and mib embryos. Bars indicate formed somite boundaries; arrowheads indicate forming boundaries. Dorsal view is anterior to top. The scale bar represents 50 μm.
(C) Time versus somite number plot for (B). Linear fits of data (R2 [wt and mib] = 0.999) yield somitogenesis periods of 20.5 min (wt) and 25.0 min (mib).
(D) Distribution of somitogenesis periods in the experiment from which (B) and (C) were taken (n [wt] = 12, n [mib] = 11). Blue bars indicate mean somitogenesis period. Temperature = 28.2 ± 0.1°C.
(E) Box-and-whisker plots of somitogenesis period: n ≥ 37 total embryos, more than six independent trials per experimental condition, except ace/fgf8, mbl/axin1, and nof/raldh2, for which n ≥ 16 total embryos, two independent trials per experimental condition. het denotes heterozygote. **p < 0.001, Student′s t test. Figures S1 and S2 show that general developmental rate is unaffected in the conditions with slower period. The central box covers the interquartile range with the mean indicated by the small square and the median by the line within the box. The whiskers extend to the 5th and 95th percentiles, and small bars depict the most extreme values.