
Image
|
Figure Caption
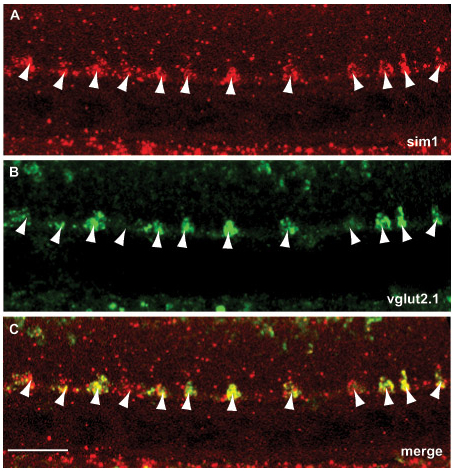
Fig. S3 Expression of vesicular glutamate transporter 2.1 (vglut2.1) in sim1-positive cells. (A) sim1 expression; (B) vglut2.1 expression; (C) merged view of A and B. Most sim1-positive cells co-express vglut2.1, indicating that they are indeed similar to mouse V3 interneurons. All embryos are 36 hpf and oriented anterior left and dorsal up. Scale bar: 25 μm.
Acknowledgments
This image is the copyrighted work of the attributed author or publisher, and
ZFIN has permission only to display this image to its users.
Additional permissions should be obtained from the applicable author or publisher of the image.
Full text @ Development