
|
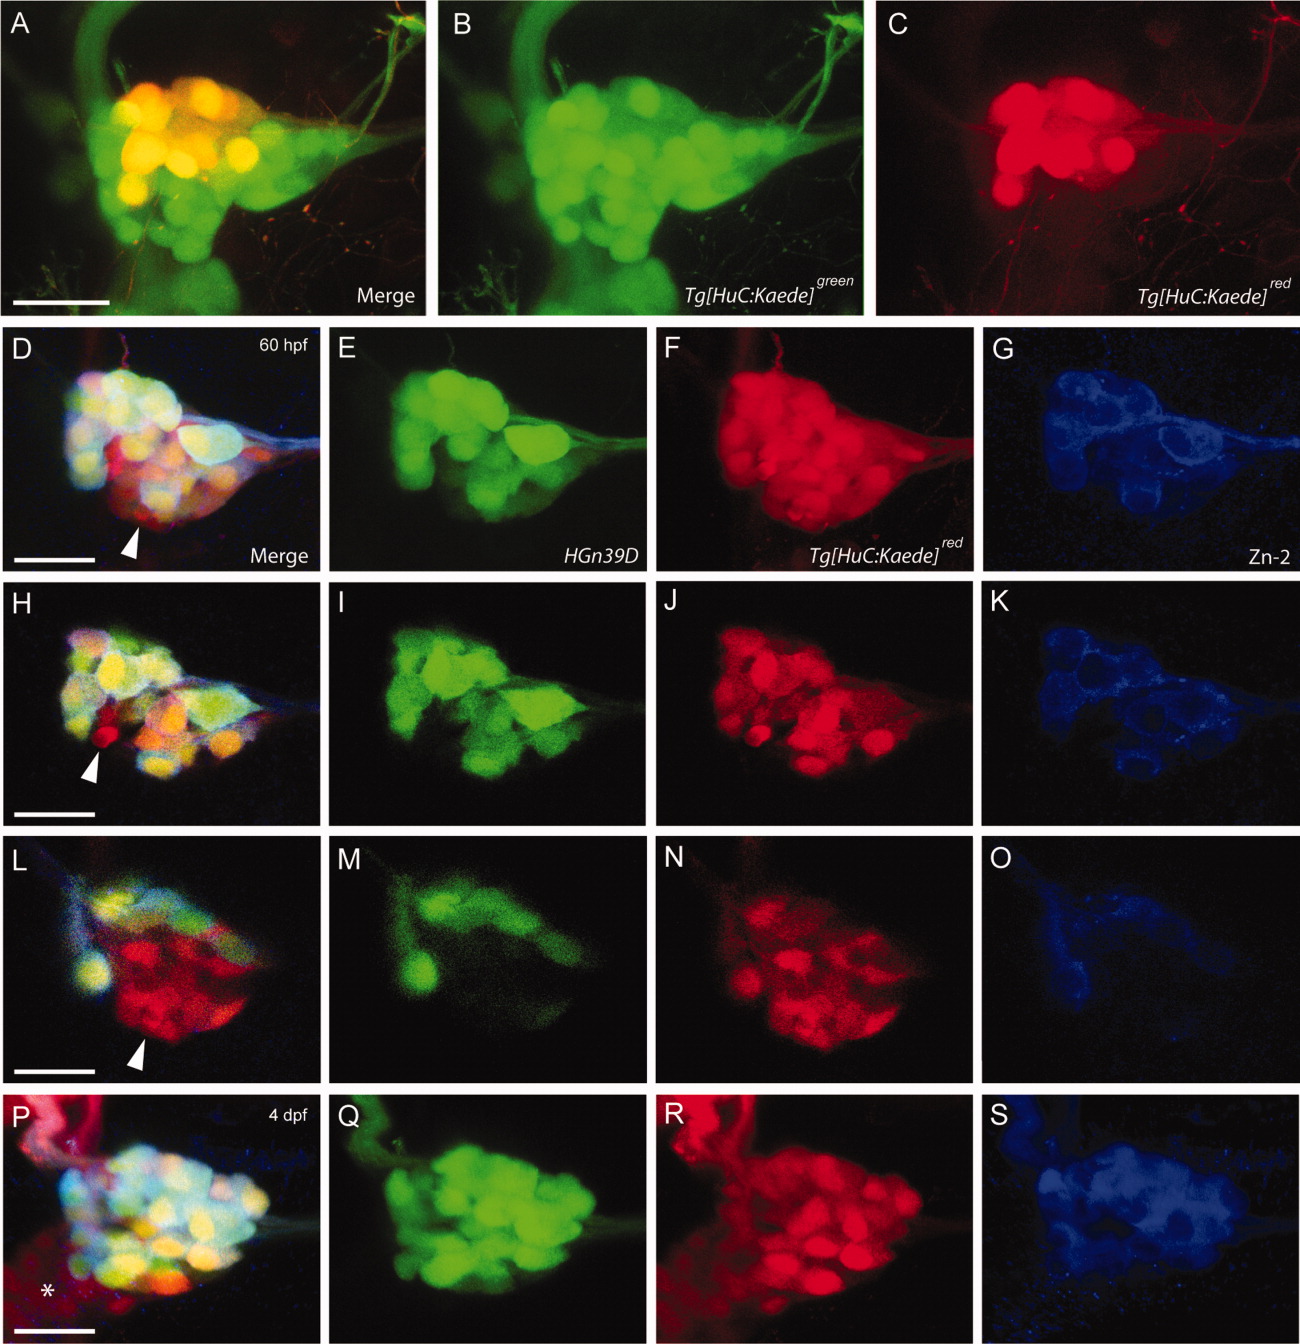
Fig. 2 Simultaneous analysis of lateralis afferent neuron differentiation time and location in the posterior lateralis ganglion. A-C: Maximal projection of a Tg[HuC:Kaede] posterior lateralis ganglion at 60 hpf resulting from a BAPTI experiment conducted at 24 hpf. A: Merge of Tg[HuC:Kaede]green (B) and Tg[HuC:Kaede]red (C) signals. Early-differentiating neurons (converted at 24 hpf) are green and red (yellow), whereas late-differentiating neurons appear only green. D-G: Maximal projection of a posterior lateralis ganglion from a Tg[HuC:Kaede]red;HGn39D double transgenic fish at 60 hpf immunostained with the monoclonal antibody Zn-2. Confocal sections of a lateral (H-K) and a medial (L-O) plane of the same ganglion shown in D-G. P-S: Posterior lateralis ganglion from a Tg[HuC:Kaede]red;HGn39D double transgenic fish at 4 dpf immunostained with Zn-2. D,H,L,P: Merge of EGFP (E,I,M,Q), Tg[HuC:Kaede]red (F,J,N,R), and Zn-2 (blue) (G,K,O,S) fluorescent signals. The posterior lateralis ganglion was exposed to 405 nm light before image acquisition in order to convert all the Tg[HuC:Kaede]greento Tg[HuC:Kaede]red. This allowed us to distinguish the HGn39D(+) neurons (green) from the Tg[HuC:Kaede](+) neurons (red). White arrowheads indicate neuronal somata, which are only Tg[HuC:Kaede]red. Asterisk in P indicates the vagus ganglion, highlighted in Tg[HuC:Kaede] but not in HGn39D transgenic fish. All images are lateral views. Dorsal is up, anterior is left. Scale bars = 20 μm.