
Image
|
Figure Caption
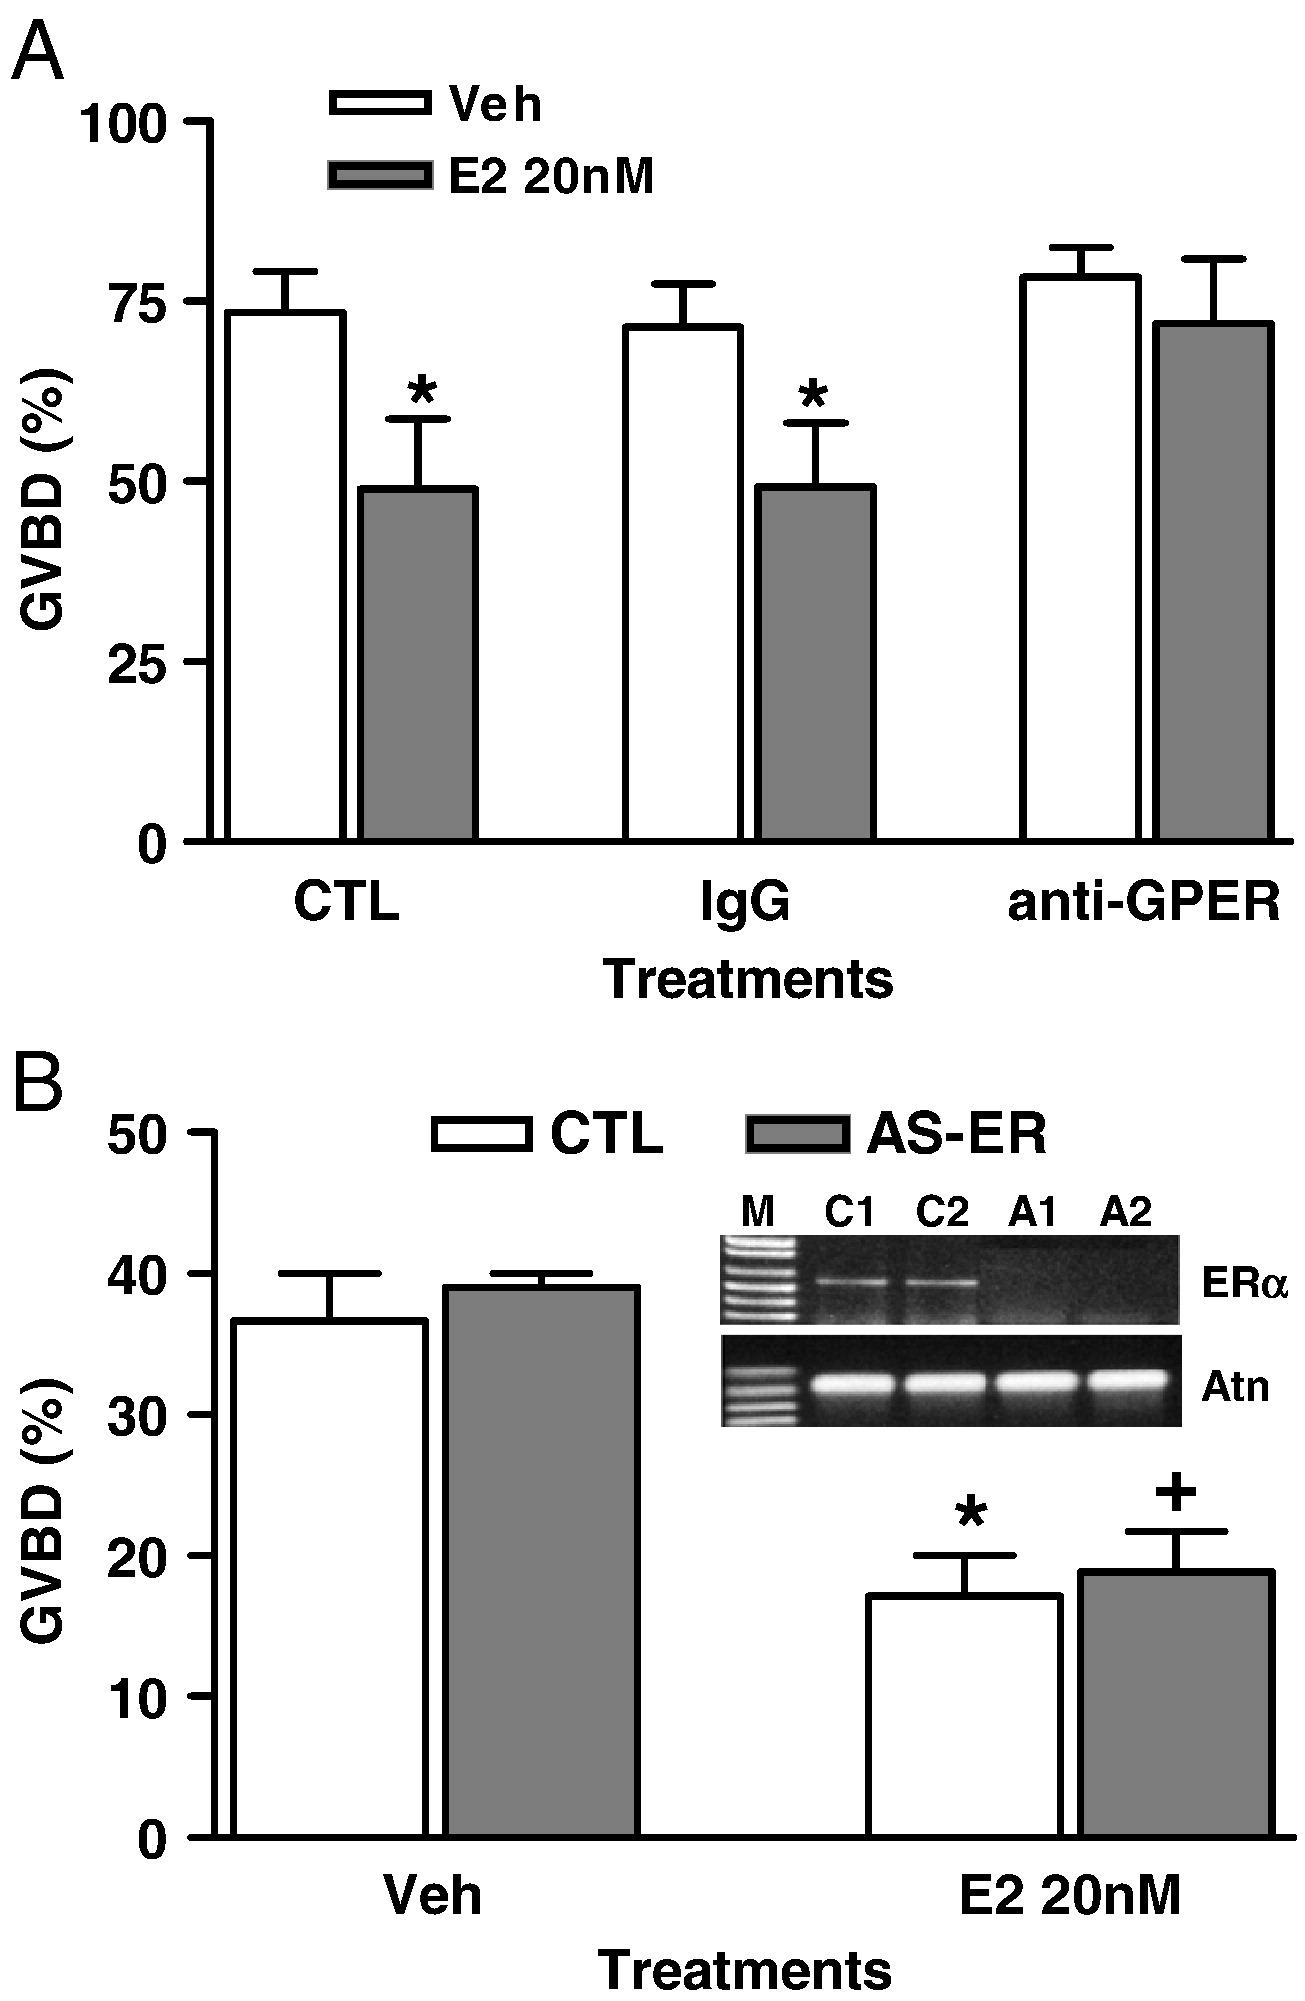
Fig. 6 Involvement of GPER in zebrafish oocyte maturation. (A) Effect of E2 on GVBD of defolliculated full-grown oocytes treated with IgG and fish GPER antibody (1:300). ∗, P < 0.05 compared to Veh. (B) Effect of E2 (20 nM) on GVBD of LV oocytes (∼ 550 μm) that had been micro-injected with control (CTL) and ERα antisense morpholino oligos. AS-ER, antisense ERα oligos. ∗, +, P < 0.05 compared to vehicle (Veh). Gel image, RT-PCR detection of ERα mRNA levels in the micro-injected oocytes. M, DNA size marker. C1 and C2, control 1 and 2. A1 and A2, antisense oligos. Atn, actin control. (N = 3).
Acknowledgments
This image is the copyrighted work of the attributed author or publisher, and
ZFIN has permission only to display this image to its users.
Additional permissions should be obtained from the applicable author or publisher of the image.
Reprinted from Developmental Biology, 342(2), Pang, Y., and Thomas, P., Role of G protein-coupled estrogen receptor 1, GPER, in inhibition of oocyte maturation by endogenous estrogens in zebrafish, 194-206, Copyright (2010) with permission from Elsevier. Full text @ Dev. Biol.