
|
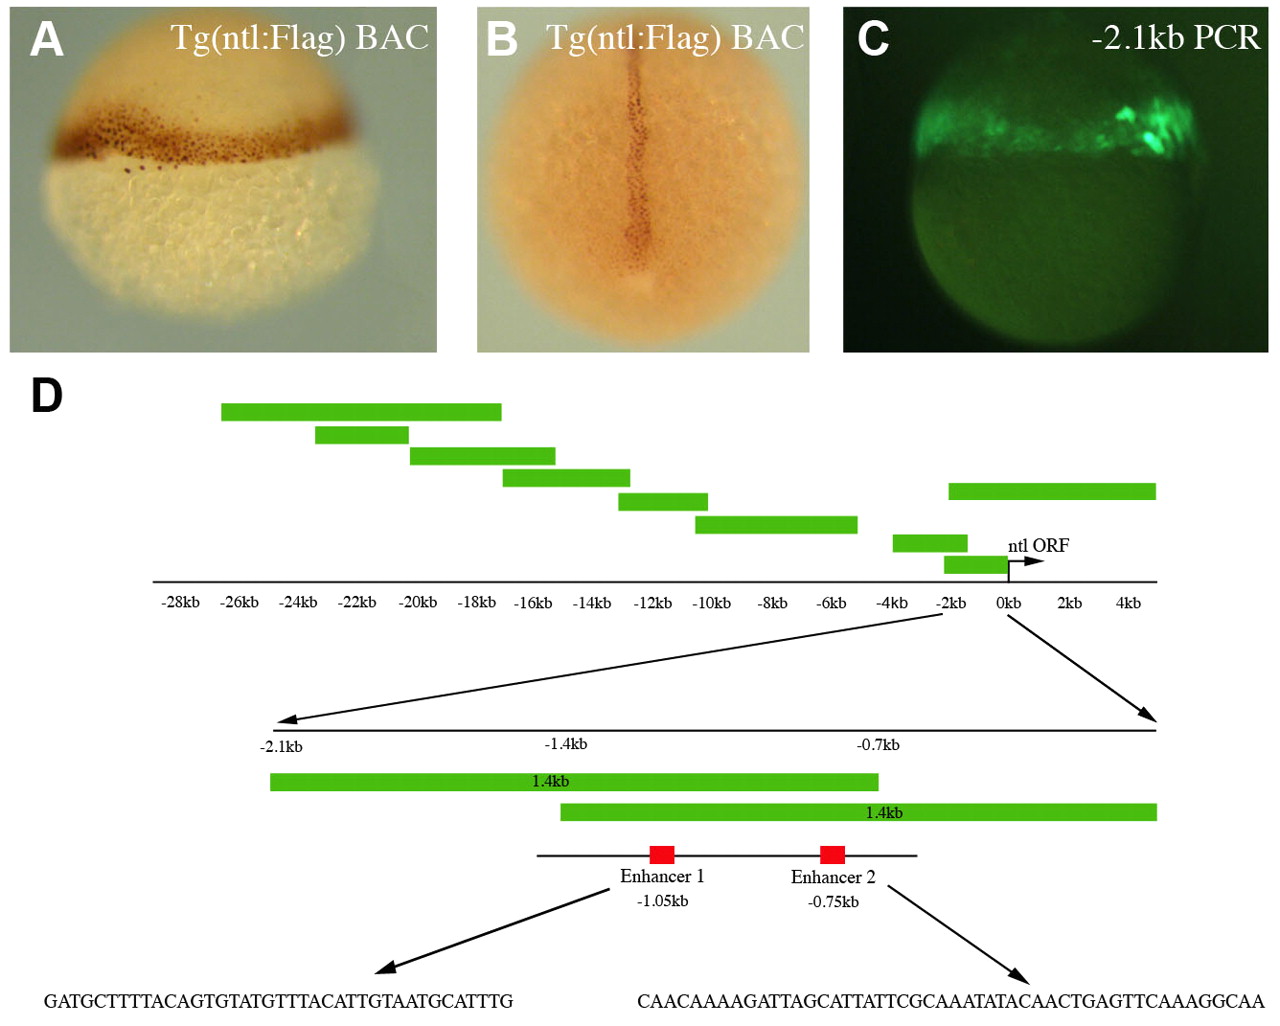
Fig. 1 Mapping the ntl regulatory elements. (A,B) Anti-Flag immunostaining of ntl:Flag BAC transgenic embryos shows expression in the margin at 6 hpf (A) and in the notochord at 11 hpf (B). (C) An embryo injected with a -2.1 kb ntl promoter PCR fragment activates GFP expression in the margin at 6 hpf. (D) An illustration of the PCR fragments generated to map the ntl regulatory elements. Two overlapping 1.4 kb fragments displayed the same enhancer properties as the 2.1 kb fragment. Within the overlapping 700 bp region (-0.7 kb to -1.4 kb) we focused on enhancer 1 (E1, 40 bp) and enhancer 2 (E2, 50 bp). The sequences of E1 and E2 are shown.