
|
Fig. 1 Movement of Lateral Mesendoderm Cells in Wild-Type Embryos
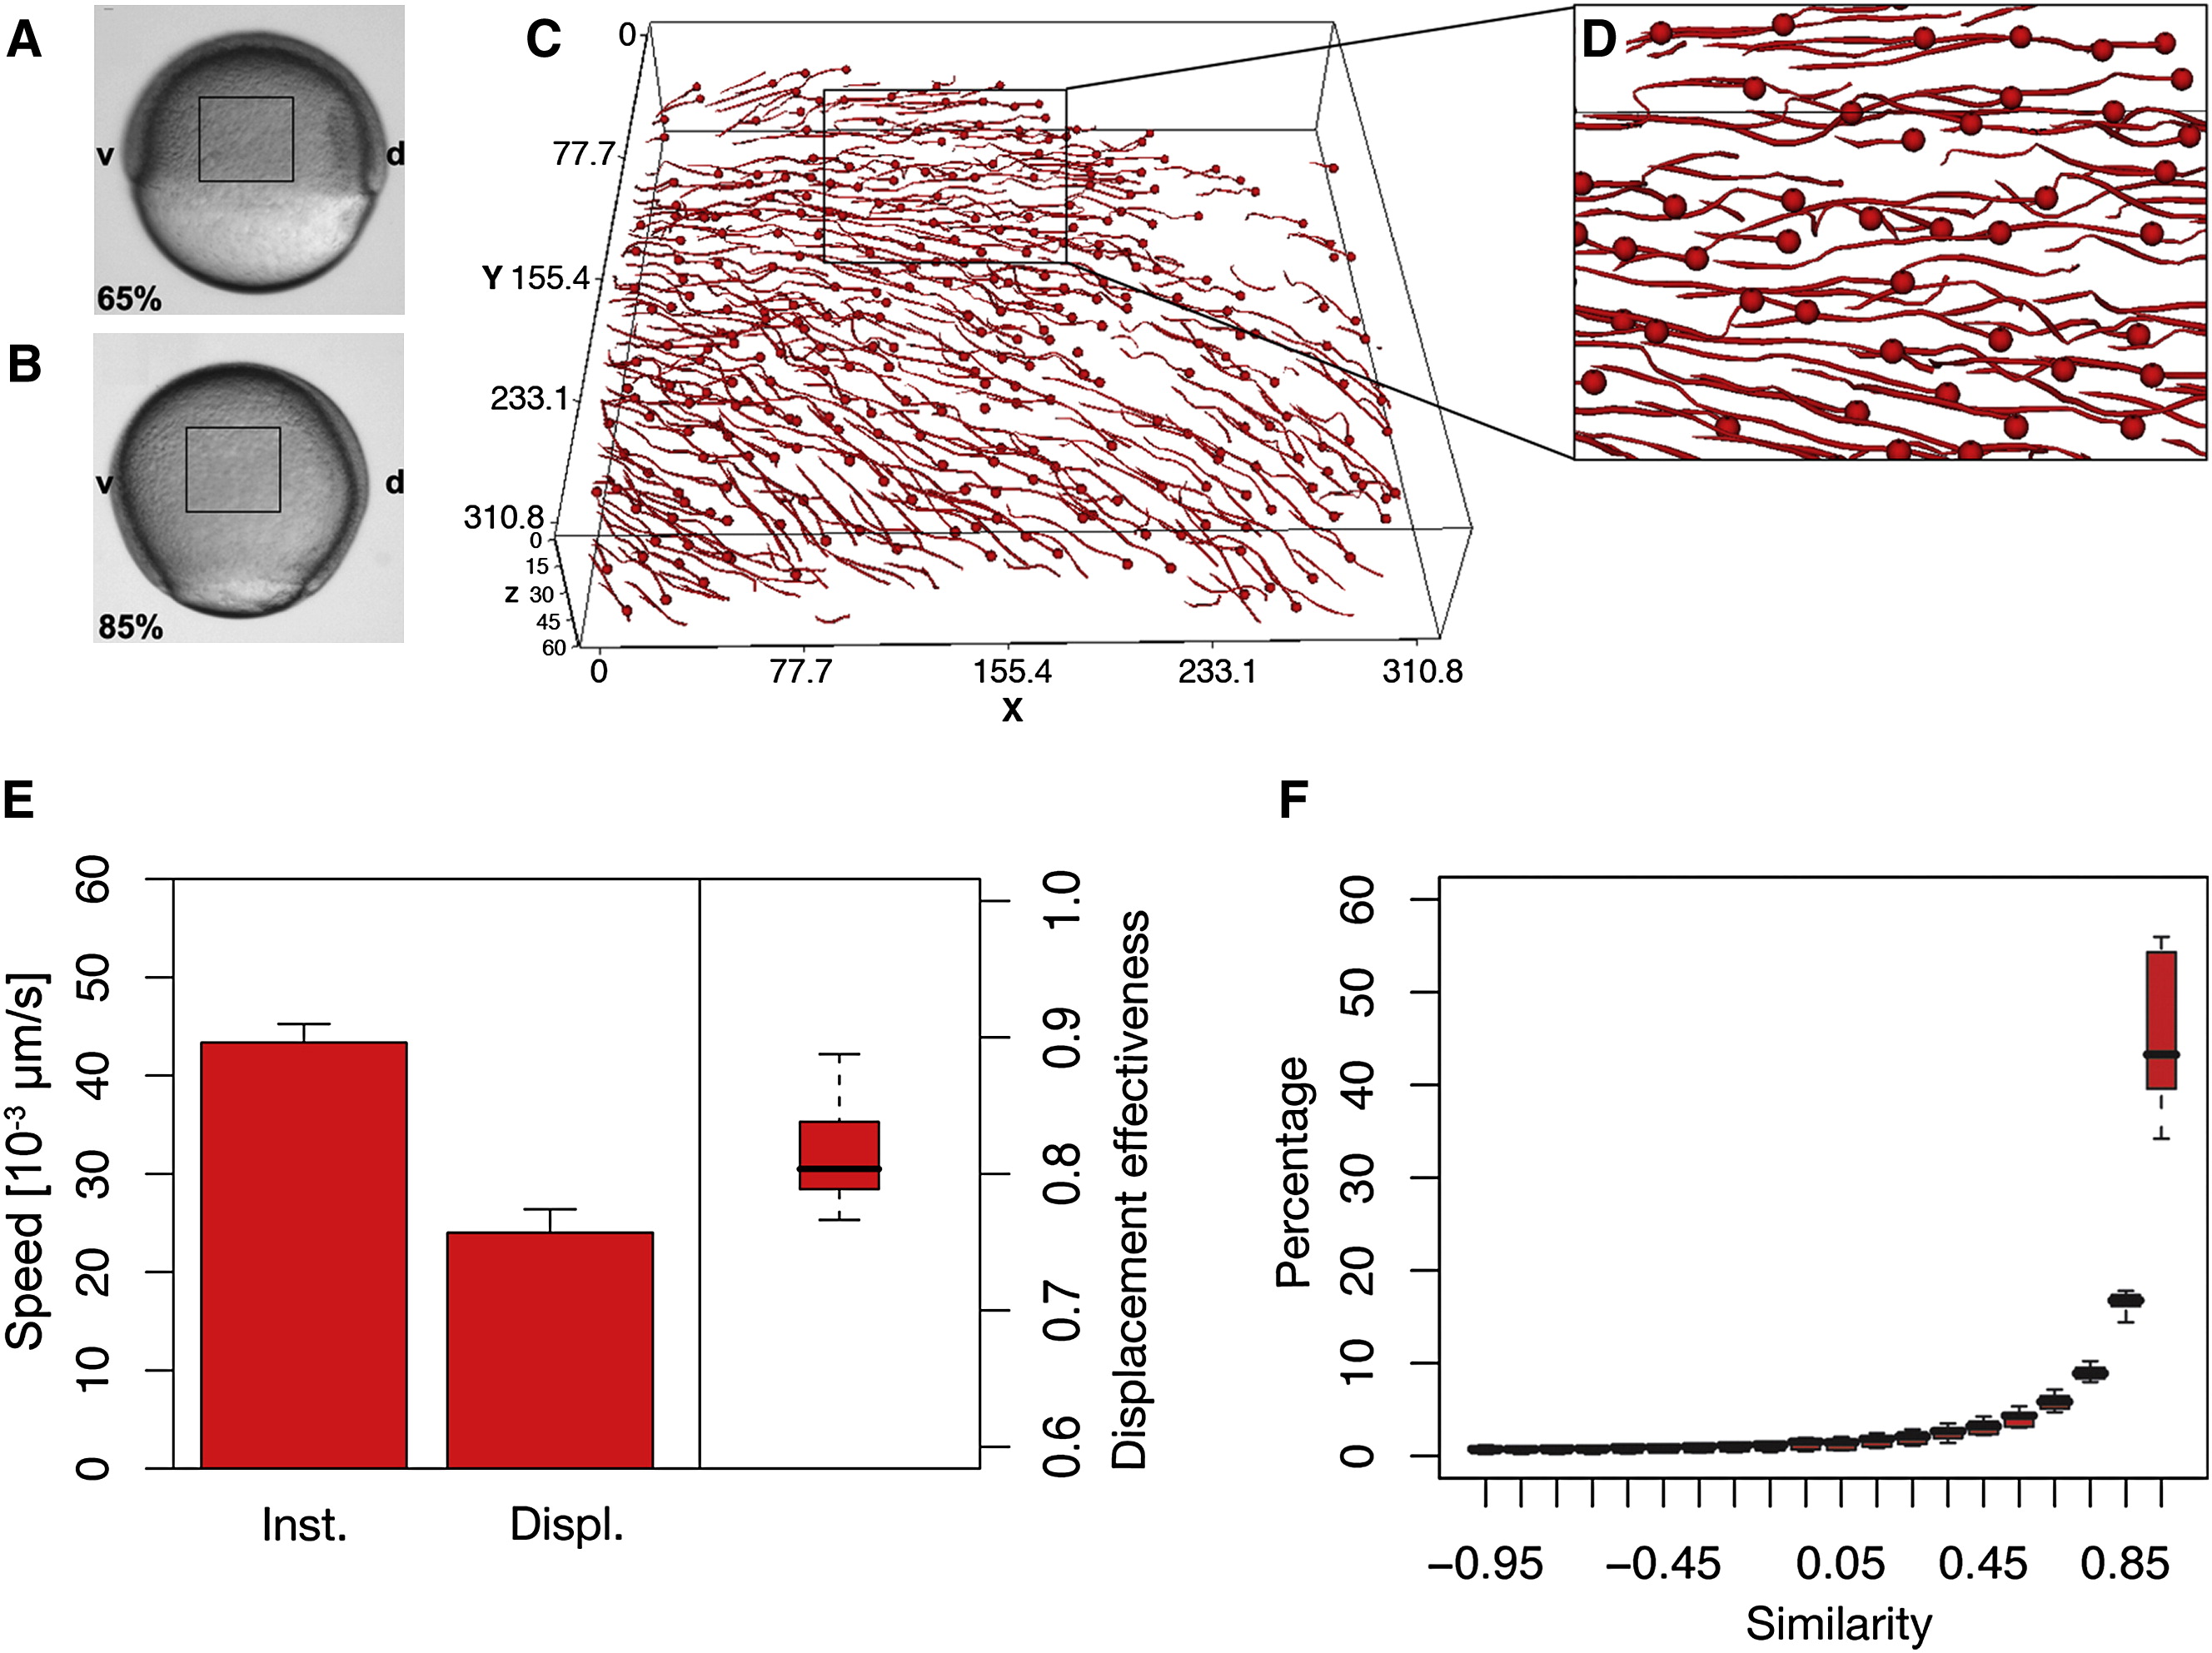
(A and B) Bright-field images of an embryo at the beginning of gastrulation (6.5 hours postfertilization [hpf]; A) and at midgastrulation (8.5 hpf; B). Boxes outline the imaged region in (C).
(C) Trajectories of mesendoderm progenitors during midgastrulation stages. Nuclei were tracked with nuclei tracking software [8]. The endpoint of each track is indicated with a sphere. The box depicts the magnified region shown in (D). Embryos were imaged by two-photon excitation microscopy from 6.5 hpf to 8.5 hpf. Animal pole is to the top and dorsal to the right.
(D) Magnified view of the boxed region in (C).
(E) Average instantaneous speed (inst.), average displacement speed (displ.), and displacement effectiveness of mesendoderm progenitors during midgastrulation stages.
(F) Instantaneous similarity of mesendoderm progenitor movements within a maximum distance of 20 μm. Values range from -1.0 (opposite direction of movement) over 0 (movement vectors are orthogonal) to +1 (parallel movement). Histograms were generated separately for each embryo. Box plots show the distribution of the bin heights among the different embryos.