
|
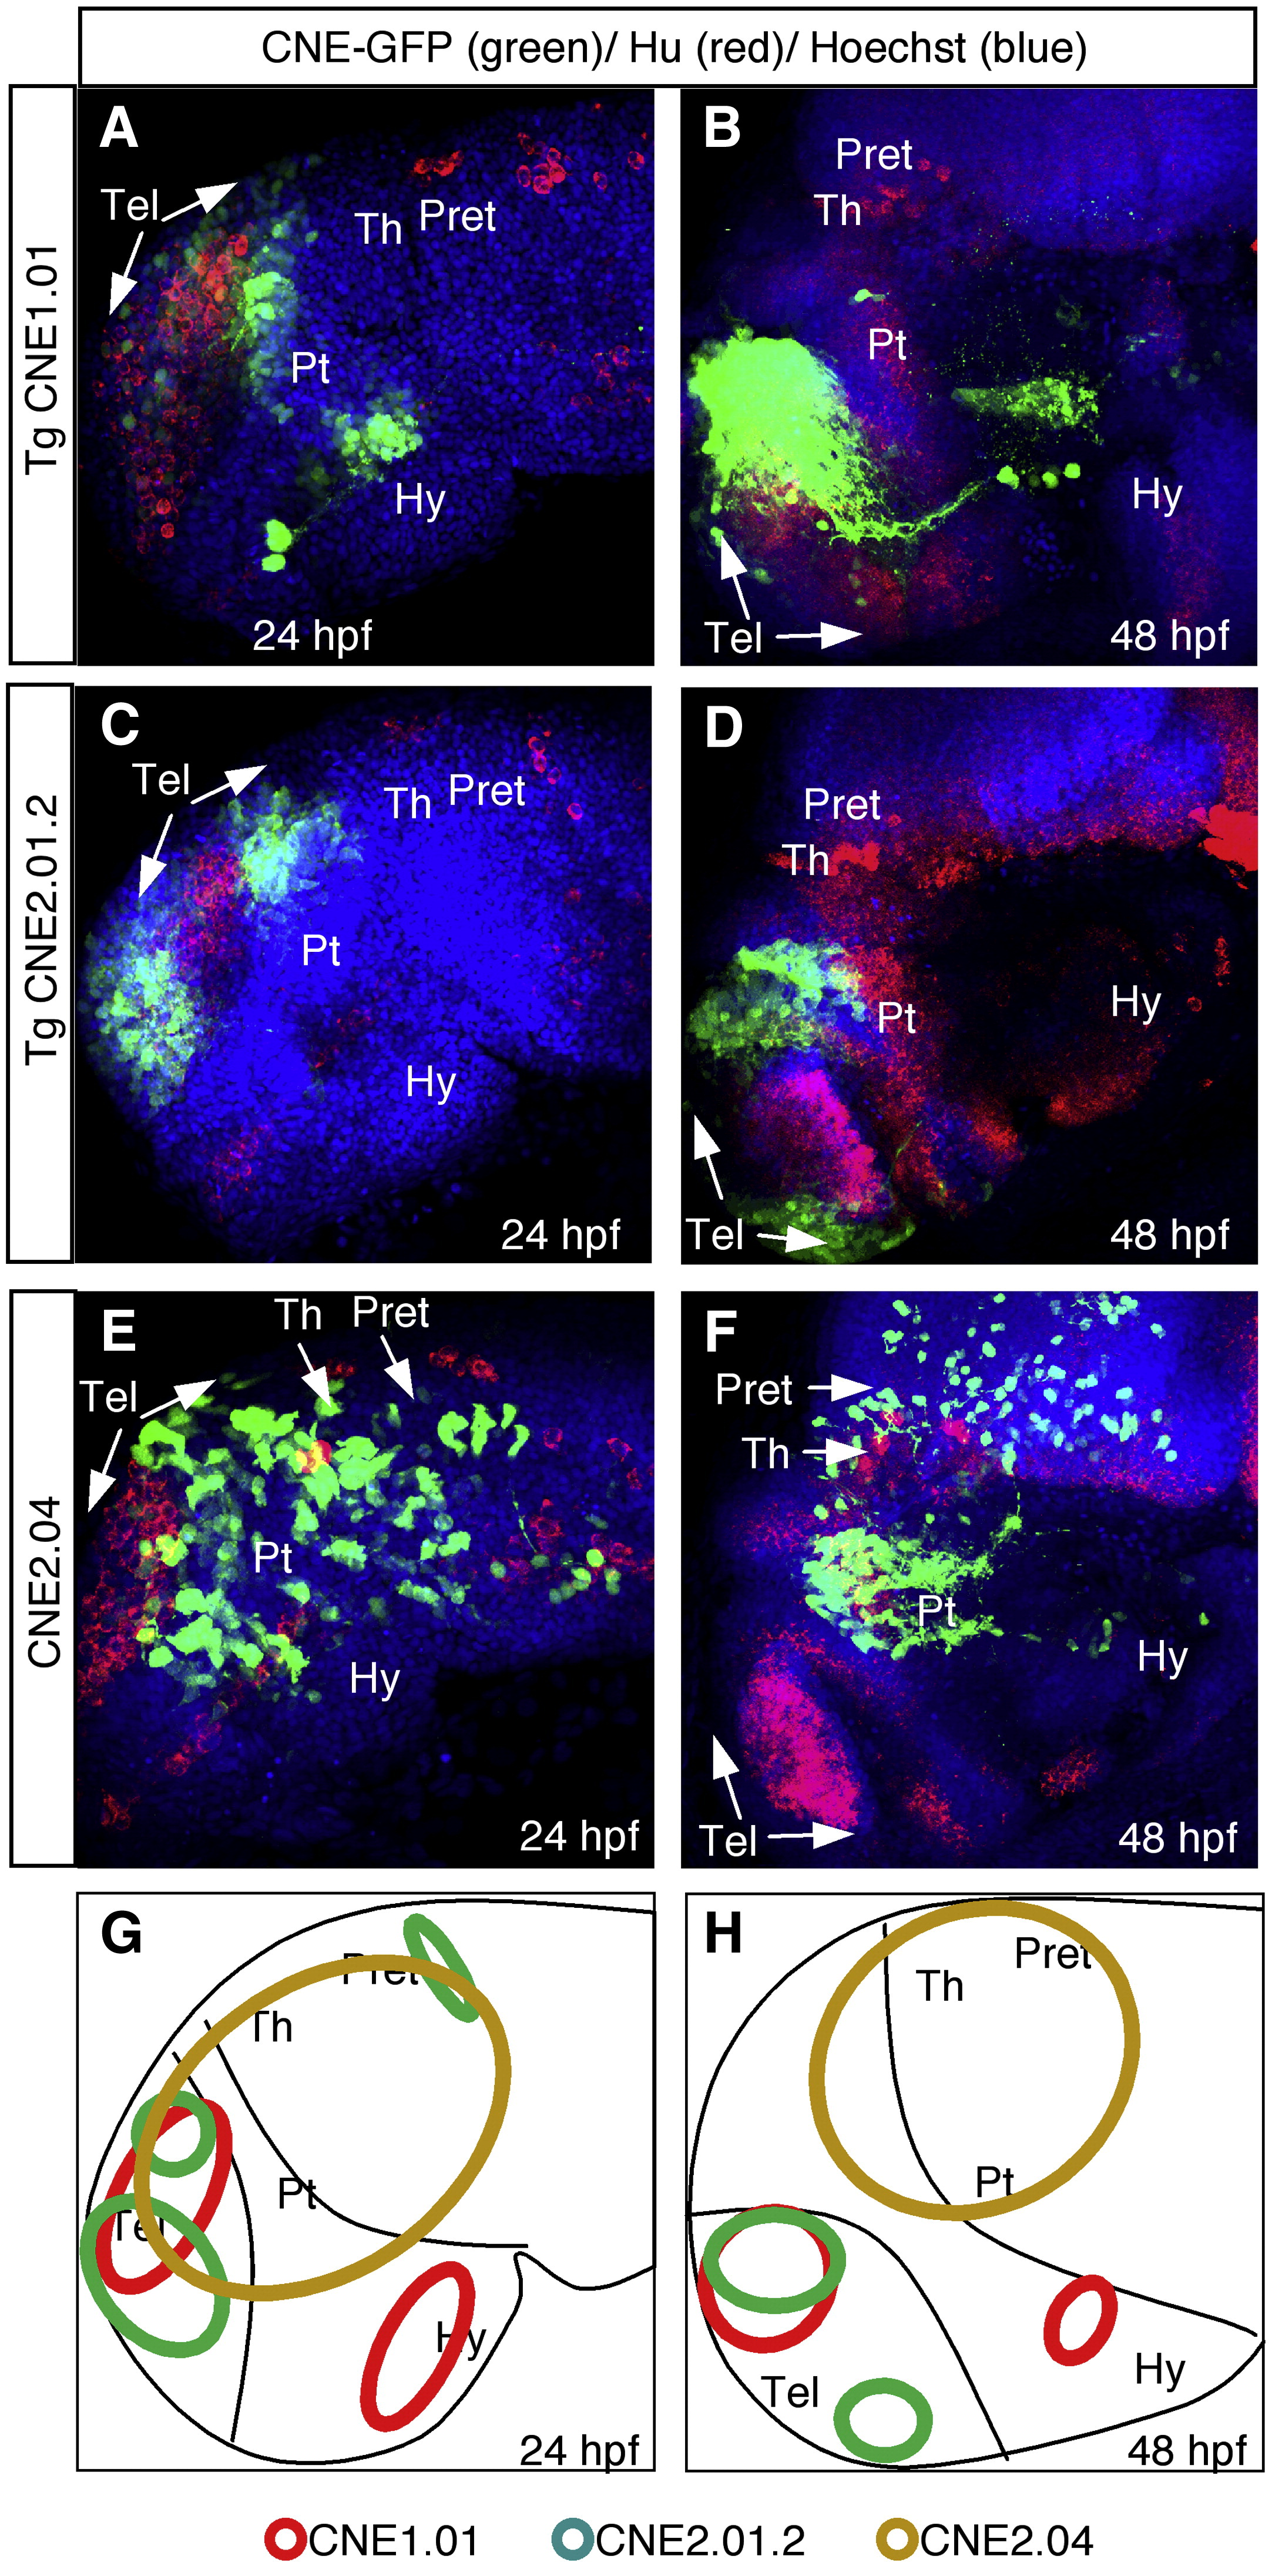
Fig. 3 High-resolution analysis of anterior brain enhancer activity. Triple labeling and confocal analysis of CNE reporter expression in zebrafish embryos. (A–B) CNE1.01 shows restricted activity in dorsal posterior telencephalon and distinct cell clusters in the hypothalamus. (C–D) CNE2.01.4 shows distinct activity in anterior and posterior telencephalon but not in medial telencpehalon, as well as sub-regions of the prethalamus. (E–F) CNE2.04 shows activity in posterior telencephalon, prethalamus, thalamus, and pre-tectal regions. (G–H). Schematic diagrams showing the anterior brain expression domains of the three CNEs shown. Abbreviations: Hy, hypothalamus; Pret, pretectum; Pt, prethalamus; Tel, telencephalon; Th, thalamus.
Reprinted from Developmental Biology, 337(2), Li, Q., Ritter, D., Yang, N., Dong, Z., Li, H., Chuang, J.H., and Guo, S., A systematic approach to identify functional motifs within vertebrate developmental enhancers, 484-495, Copyright (2010) with permission from Elsevier. Full text @ Dev. Biol.