
Image
|
Figure Caption
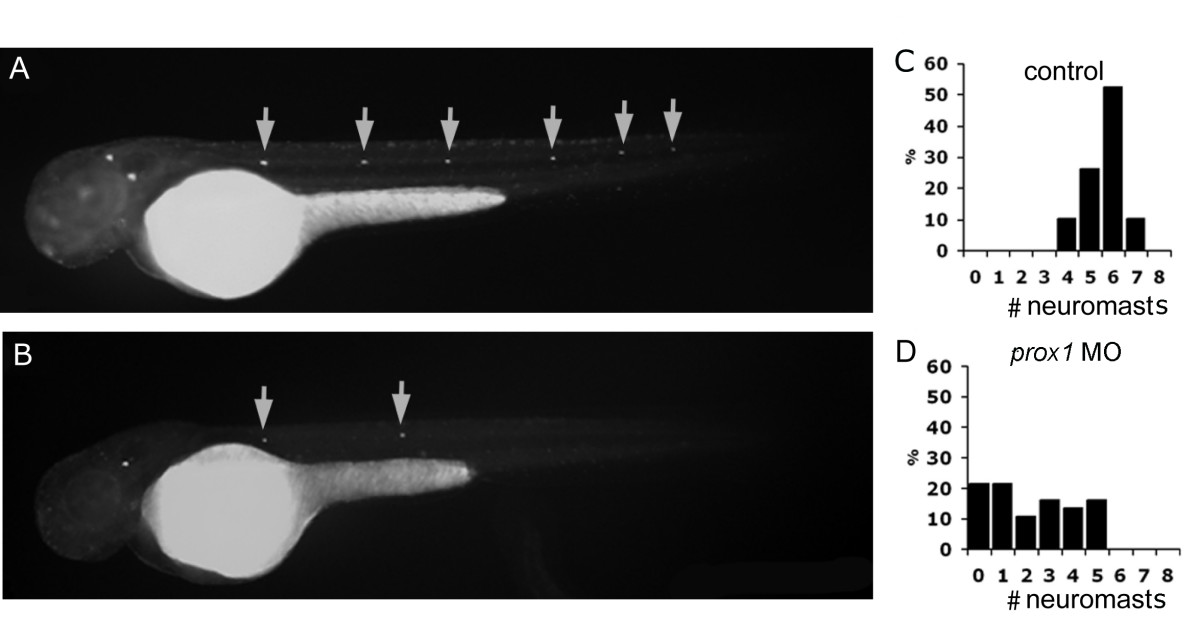
Fig. 3 Diasp staining in control and prox1 loss of function embryos at 48 hpf. (A, B) Microinjection of prox1 MO decreases the number of Diasp positive cells in comparison to control embryos at the same developmental stage. (C, D) The number of Diasp-labeled neuromasts per larva at 48 hpf were counted and larvae were classified according to the number of neuromasts present on one side. While most control larvae show between 5 and 8 neuromasts (C), prox1 MO injected larvae display between 0 and 5 neuromasts per side (D).
Figure Data
Acknowledgments
This image is the copyrighted work of the attributed author or publisher, and
ZFIN has permission only to display this image to its users.
Additional permissions should be obtained from the applicable author or publisher of the image.
Full text @ BMC Dev. Biol.