
|
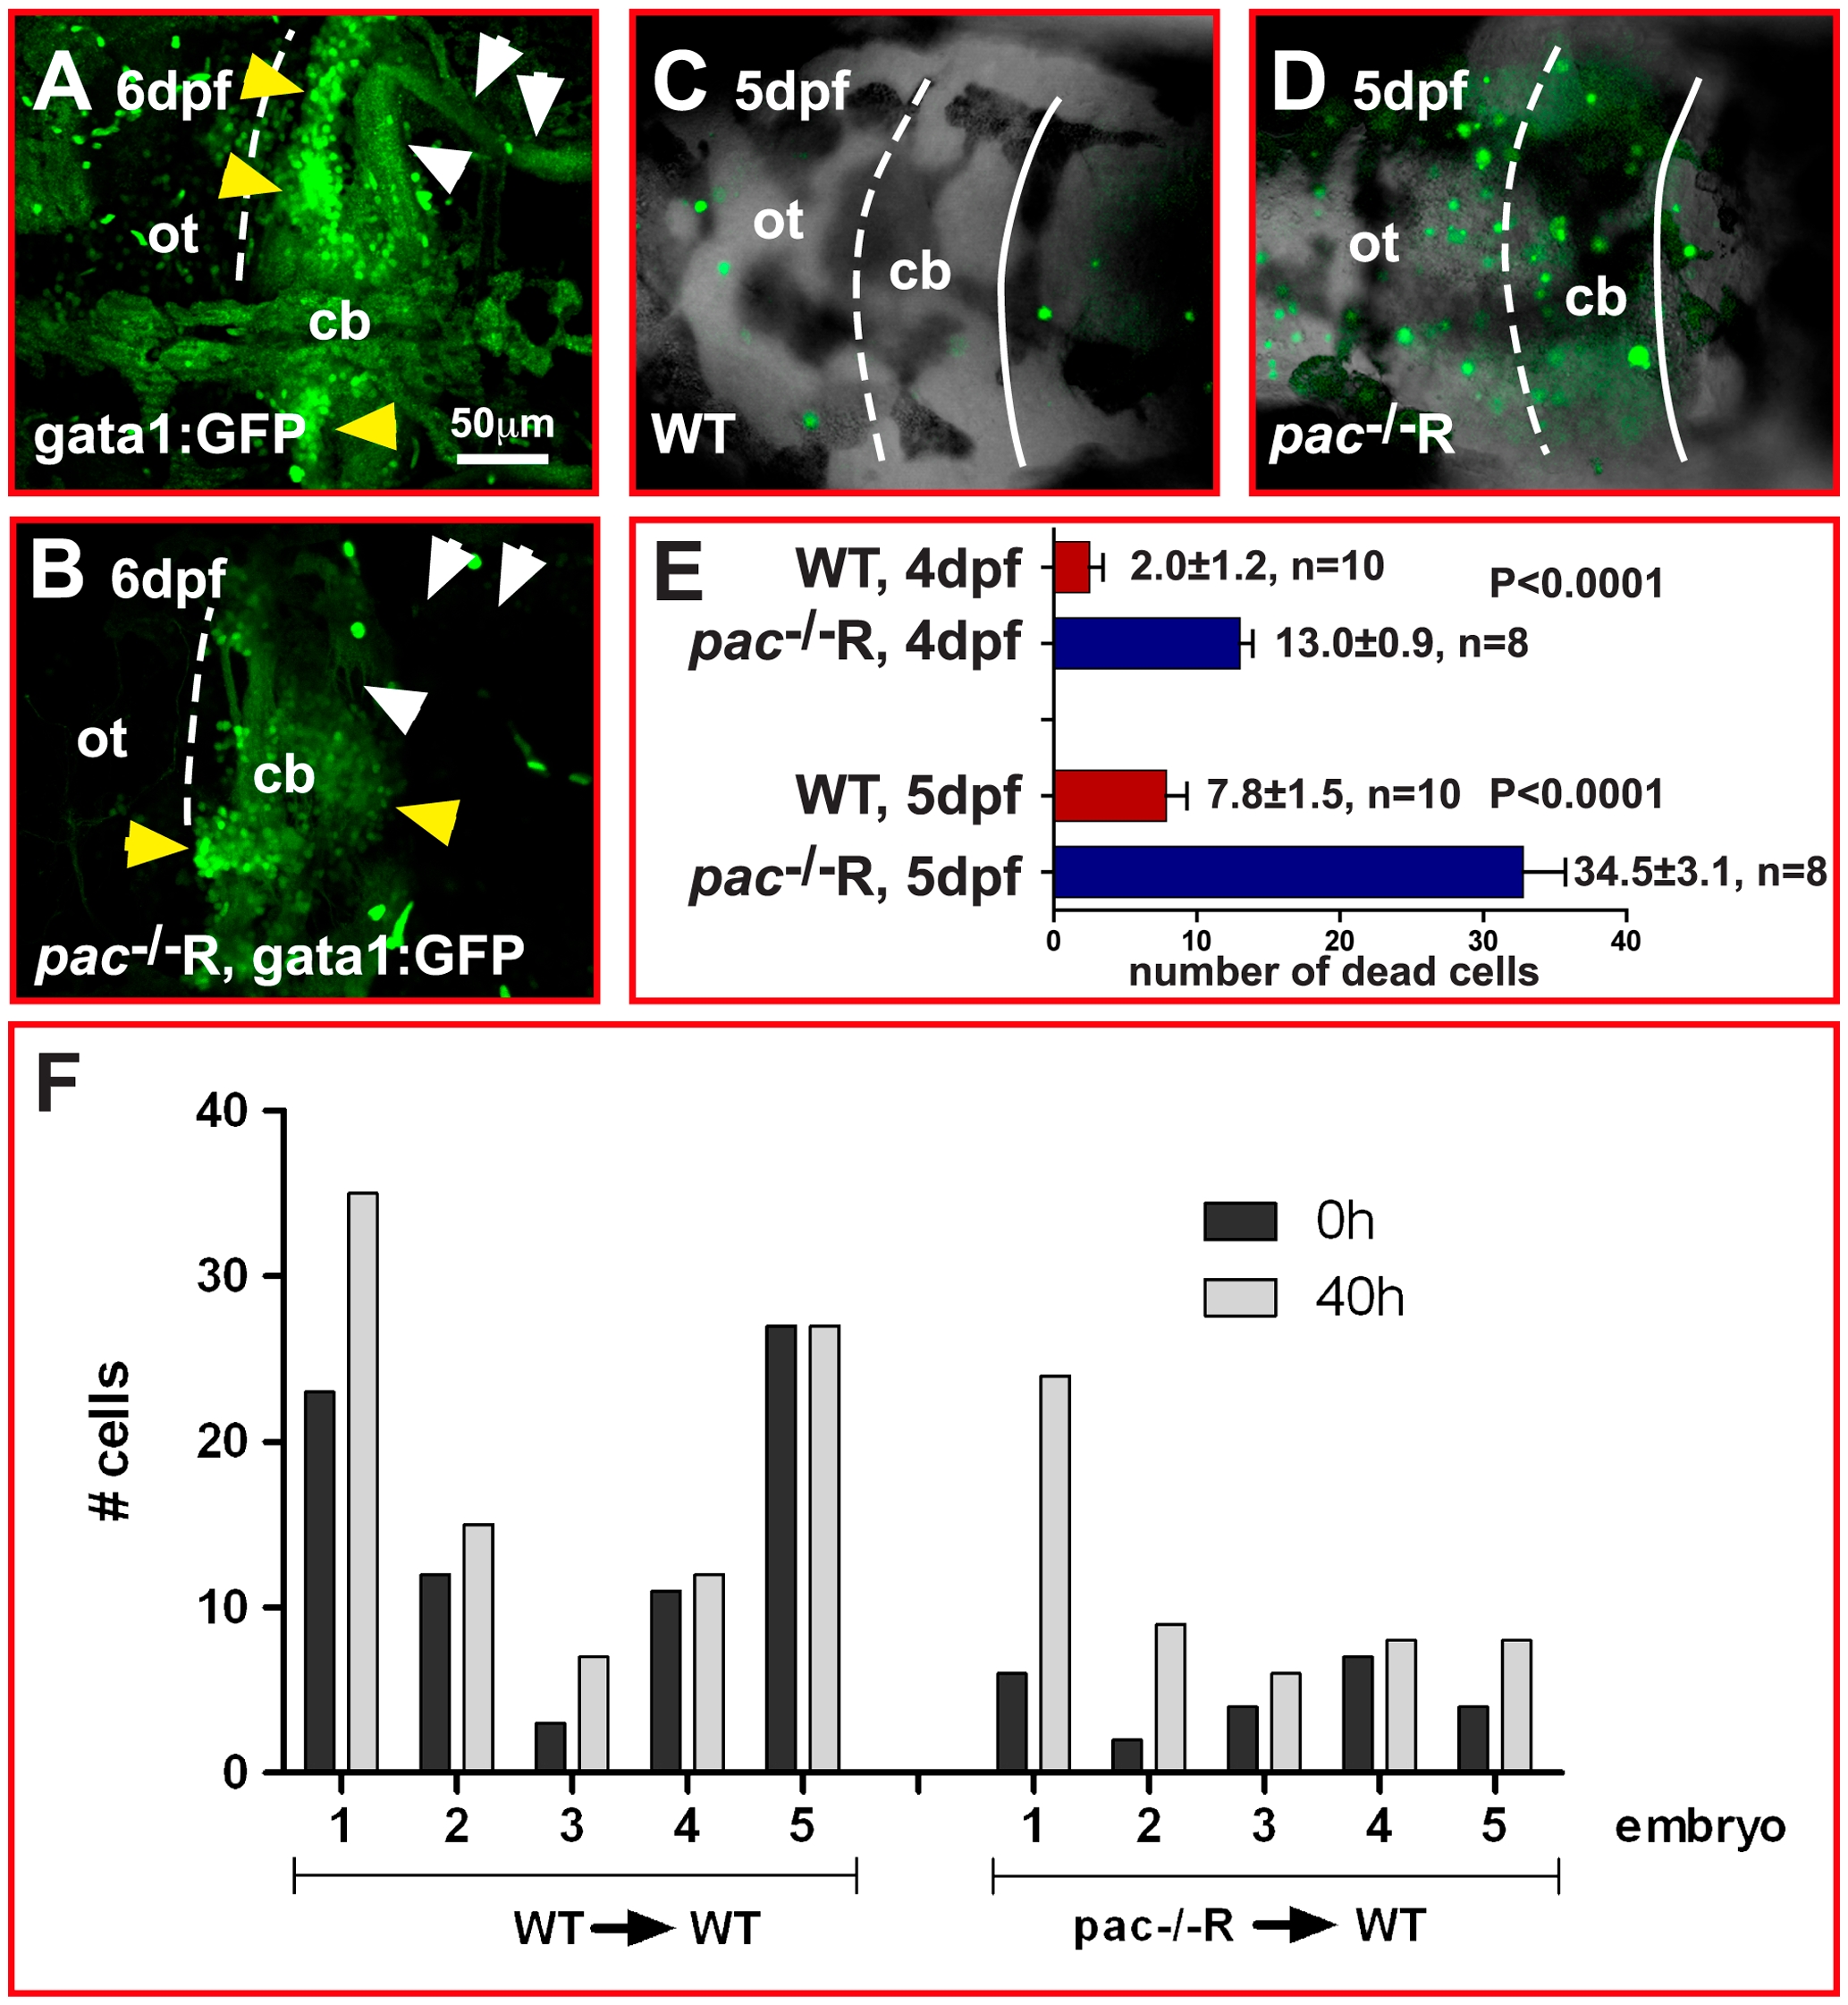
Fig. 12 Increased cell death in pac-/-R cerebella at 5 dpf.
(A–D) Dorsal views of confocal image stacks showing projected gata1:GFP WT (A) and pac-/-R (B) cerebella. Comparison indicates that the number of GFP-expressing GCs (yellow arrowheads) is severely reduced in pac-/-R and parallel fiber projections (white arrowheads) are lacking, consistent with a strong increase in cell death as visualized by acridine orange staining (compare WT: C to pac-/-R: D). (E) Quantification reveals that cell death in pac-/-R increases 3-fold between 4 and 5 dpf (after GC migration has ceased). For analysis, the student t-test was used, ***p<0.0001. Error bars indicate SEM. (F) Quantification of WT and pac-/-R donor cells in WT hosts (n = 5 embryos in each group, numbered 1–5 in graph) at 0 h (∼48–51 hpf) and termination of migration (40 h later) does not show decreased GC numbers, indicating that cell death occurs after migration during terminal GC differentiation. cb, cerebellum; ot, optic tectum.