
|
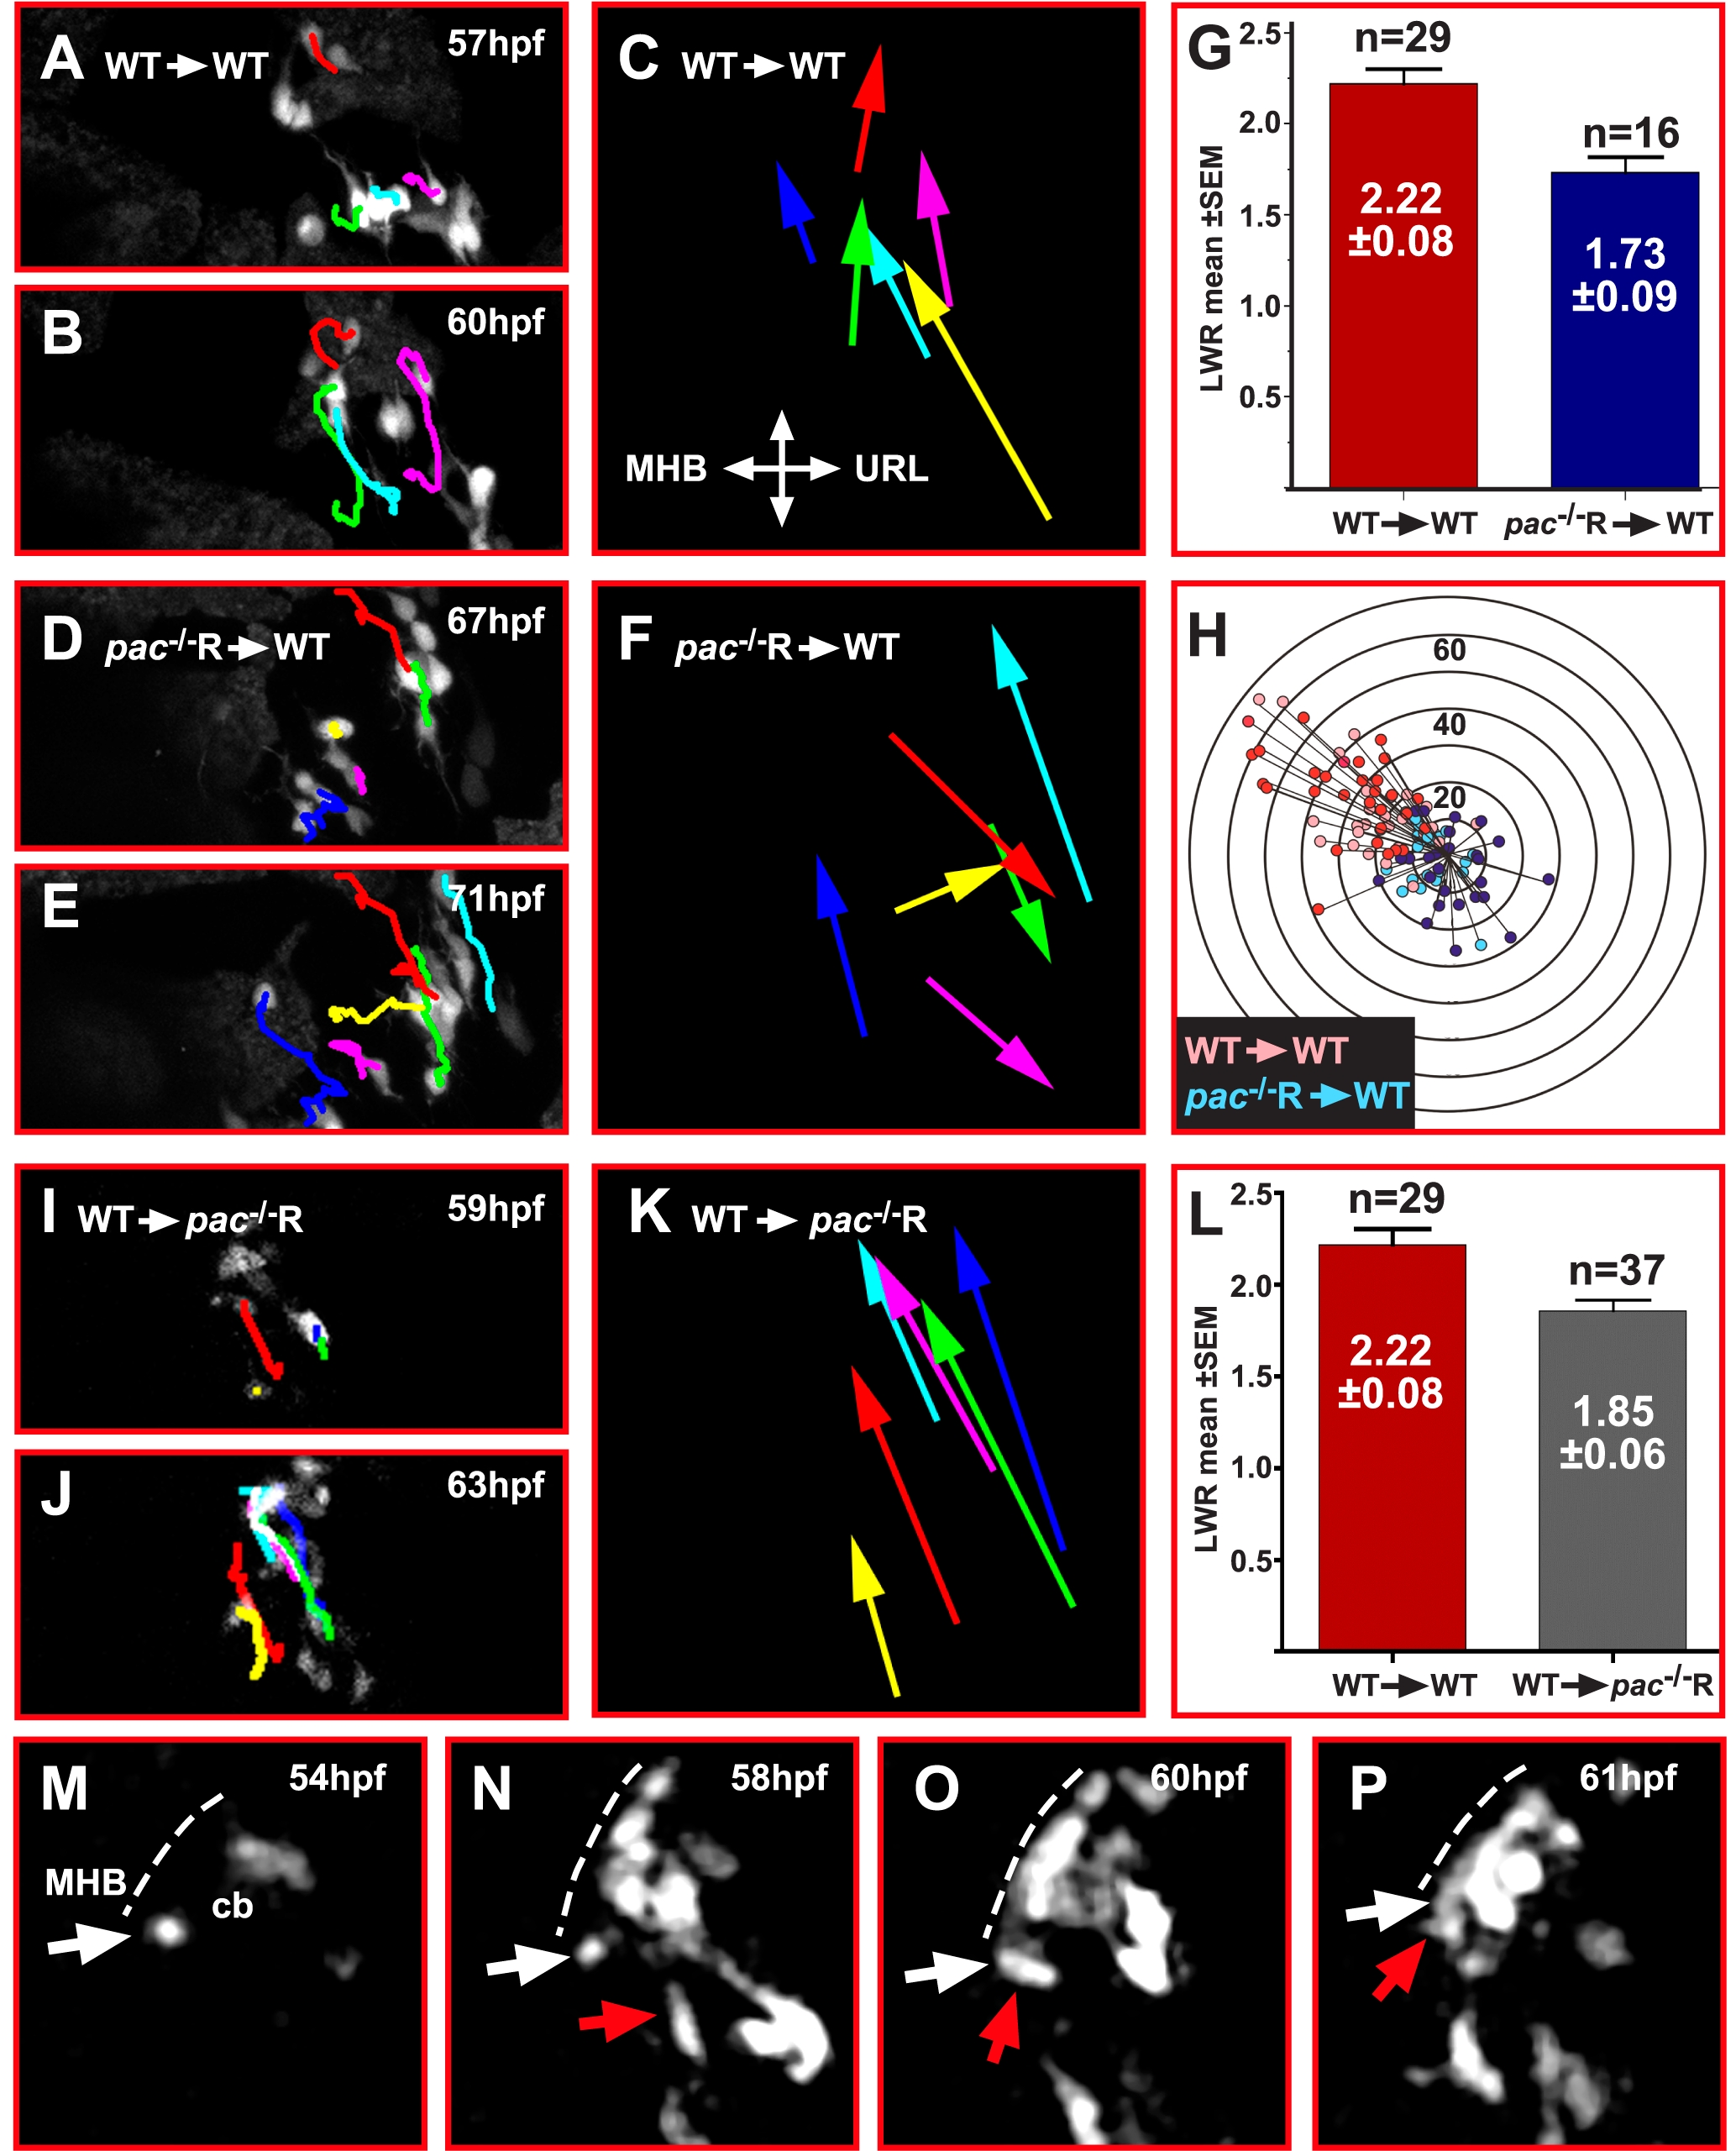
Fig. 5 Cadherin-2 deficient GCs lack directional migration when transplanted into WT embryos.
(A, B, D, E, I, J) Maximum intensity projections (dorsal view) of time-lapse recordings showing transplanted gata1:GFP/WT (A–C) and gata1:GFP/pac-/-R (D–F) donor GCs in the right cerebellar lobe of a WT host, whereas (I, J) shows transplanted gata1:GFP/WT GCs in a pac-/-R host cerebellum. Donor GCs derived from WT-WT transplantations are clearly polarized (G, red column, LWR: 2.22±0.08, n = 29) and migrate in a cohesive and directional manner, supported by cell tracing overlays (C) (see also Video S7, n = 4). In contrast, migration of pac-/-R donor GCs in a WT cerebellum is non-cohesive and non-directional, despite polarization of these cells (G, blue column, LWR: 1.73±0.09, n = 16) (see also Video S8, n = 4). (H) Distance and migration direction of WT and mutant donor GCs (gata1:GFP/WT-WT: pink, n = 33; gata1:GFP/pac-/-R: light blue, n = 18) in WT cerebella overlaid with tracings from respective non-transplanted GCs (see Figure 4C), i.e. gata1:GFP/WT (red) and gata1:GFP/pac-/-R GCs (dark blue) to show a similar migration pattern in both respective groups (WT + WT-WT and pac-/-R + pac-/-R-WT. (I–K) Transplanted gata1:GFP/WT GCs migrate in a pac-/-R host cerebellum in a cohesive and directional manner, supported by cell tracing overlays (see also Video S9, n = 3). (L) These Gata1:GFP/WT donors are polarized in a pac-/-R mutant environment as indicated by their LWRs (WT-WT 2.22±0.08; pac-/-R 1.85±0.06). (M–P) Transplantation of gata1:GFP/WT donor GCs into pac-/-R hosts revealing directional chain migration of WT GCs in a pac-/-R cerebellum. Note the group of GCs (red arrow in N, O, P) collectively migrating toward the MHB (dotted line) contacting an isolated quiescent GC, which subsequently joins the migrating GC chain (see also Video S9). All images are maximum intensity projections (dorsal view) of time-lapse recordings. Error bars indicate SEM. MHB: midbrain-hindbrain boundary.