
|
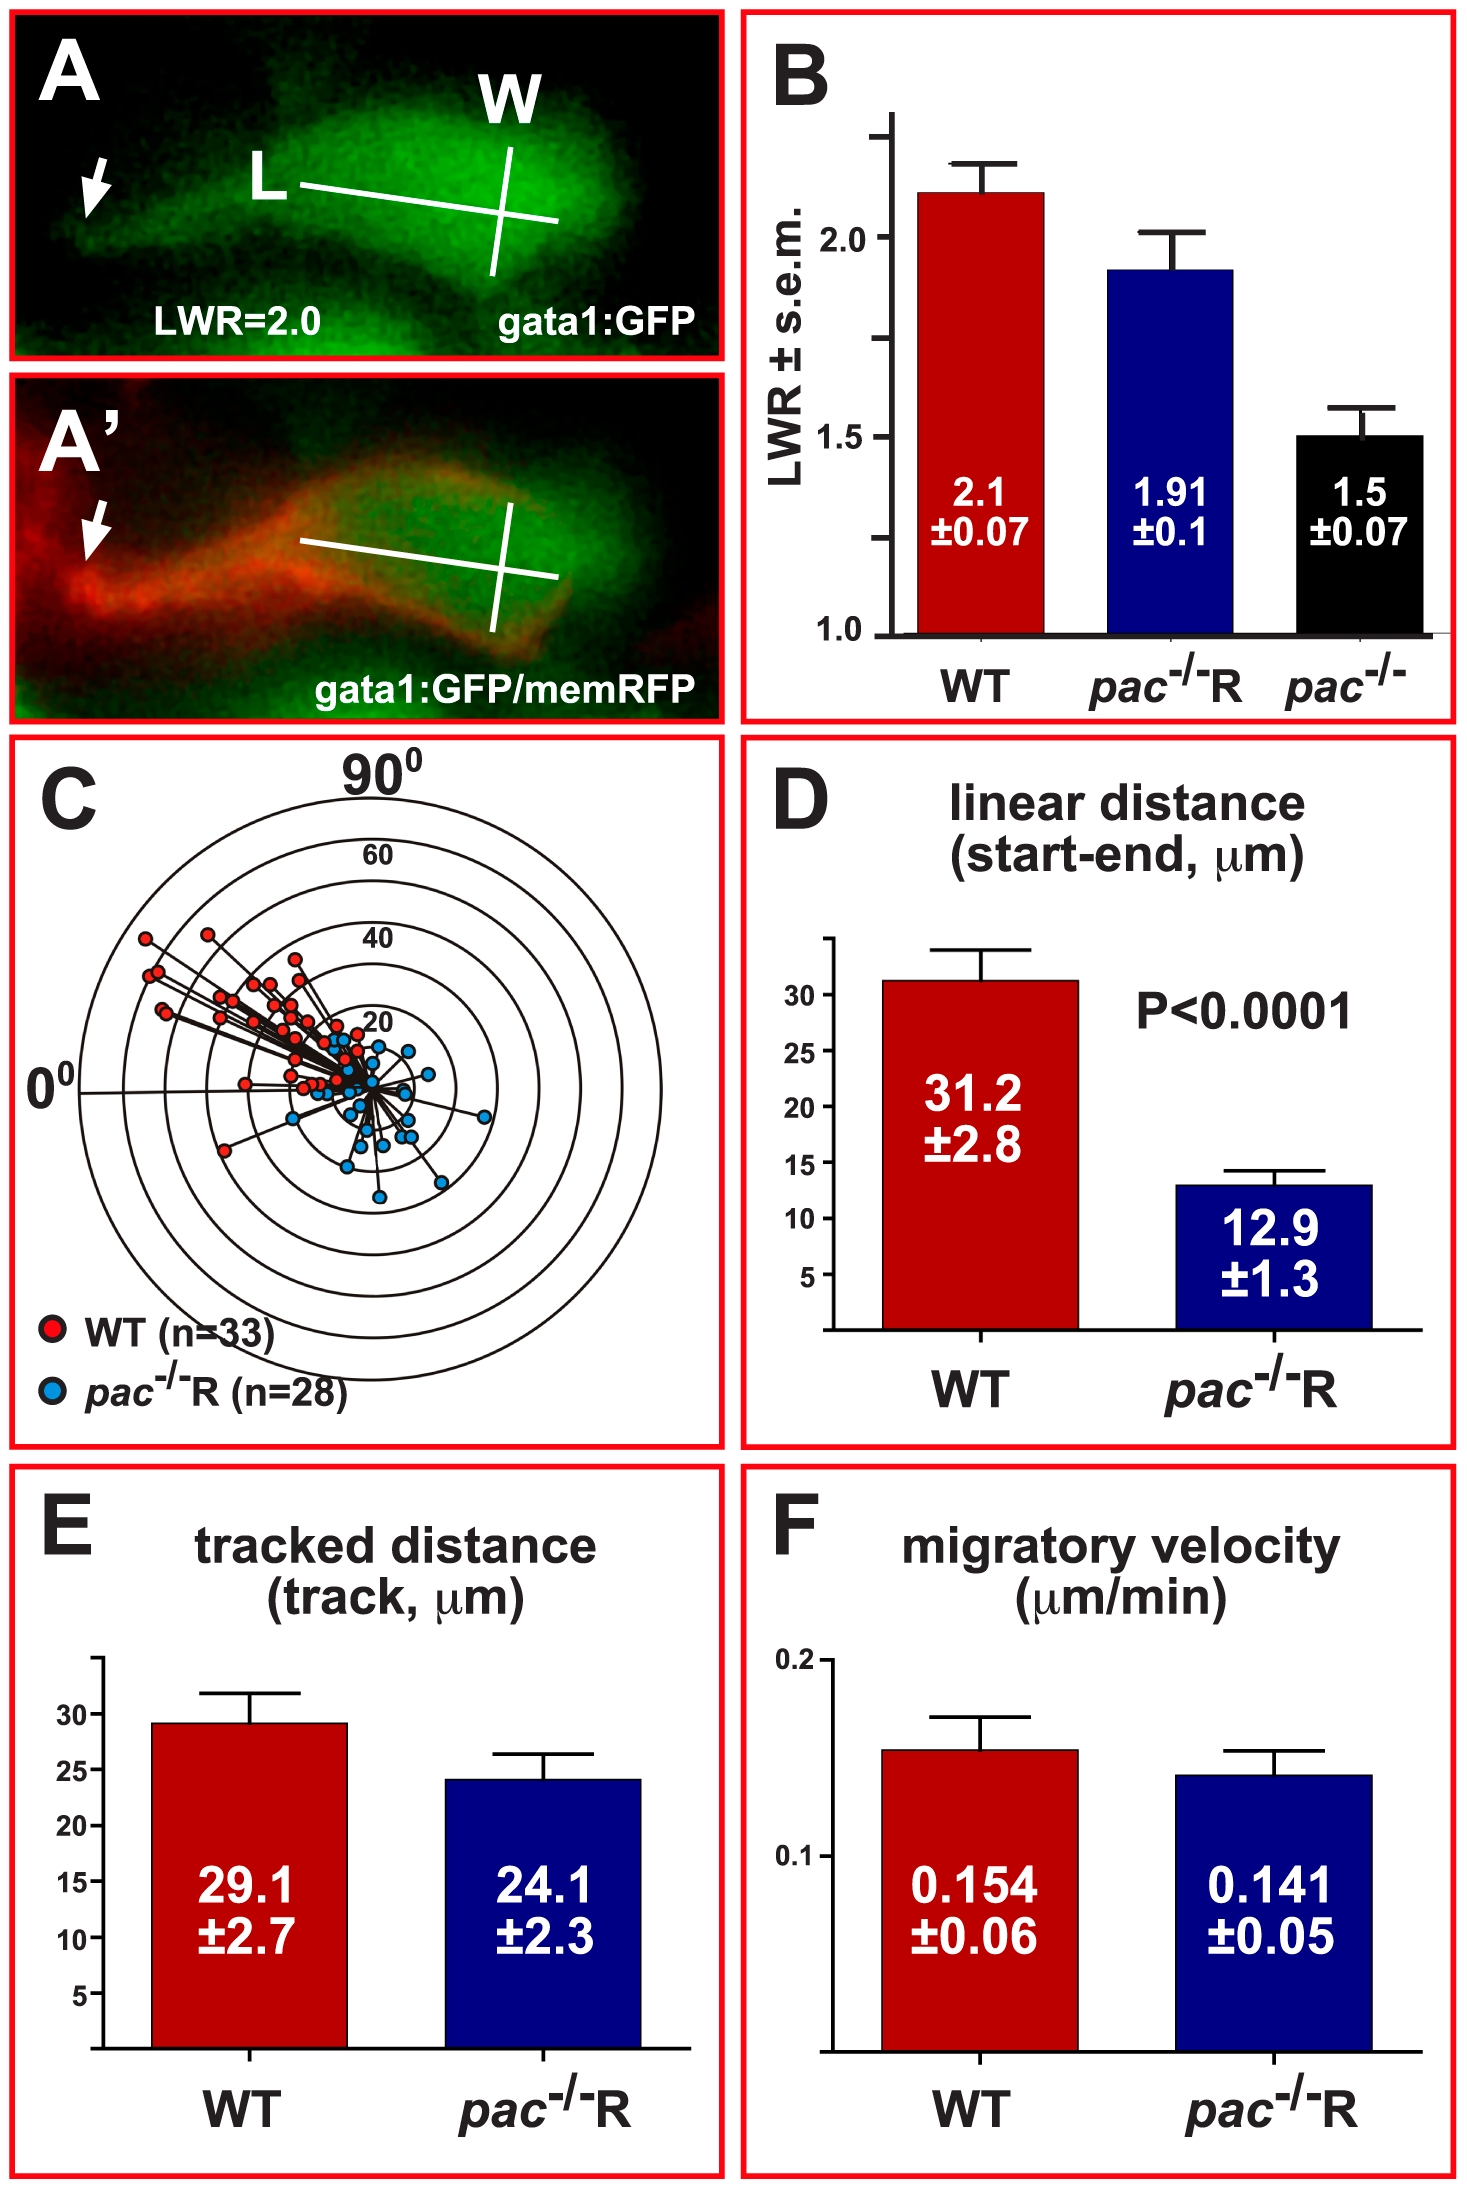
Fig. 4 Cadherin-2 maintains directionality but not velocity of cerebellar GC migration.
(A) Example of length-width measurements in individual gata1:GFP GCs, co-expressing membrane-bound RFP to visualize cell contours (A′, see also Video S6). (B) WT GCs (LWR 2.1±0.07, n = 50) and pac-/-R GCs (LWR 1.91±0.1, n = 41) clearly polarize, unlike GCs in pac-/--mutants (LWR 1.5±0.07, n = 51). (C) Graph showing the migrated distance of GCs plotted against their direction over a time course of 4 hours (0° marks MHB, 90° marks lateral edge of cb, concentric circles indicate migration distance in 10 μm steps). The orientation of GCs in gata1:GFP-embryos (Figure 8C) correlates well with their migratory direction (red dots, n = 33). Similarly, the random orientation of GCs in gata1:GFP/pac-/-R-embryos (Figure 8C) leads to random migration with no preferred direction (blue dots, n = 28). (D) The linear migration distance is dramatically reduced for pac-/-R GCs (12.9±1.3 μm), compared to WT GCs (31.2±2.8 μm), while traced distances (E, WT: 29.1±2.7 μm versus pac-/-R: 24.1±2.3 μm) and migratory velocities (F, WT: 0.154±0.06 μm/min versus pac-/-R: 0.141±0.05 μm/min) are nearly identical. Error bars indicate standard errors of the mean (SEM).