
Image
|
Figure Caption
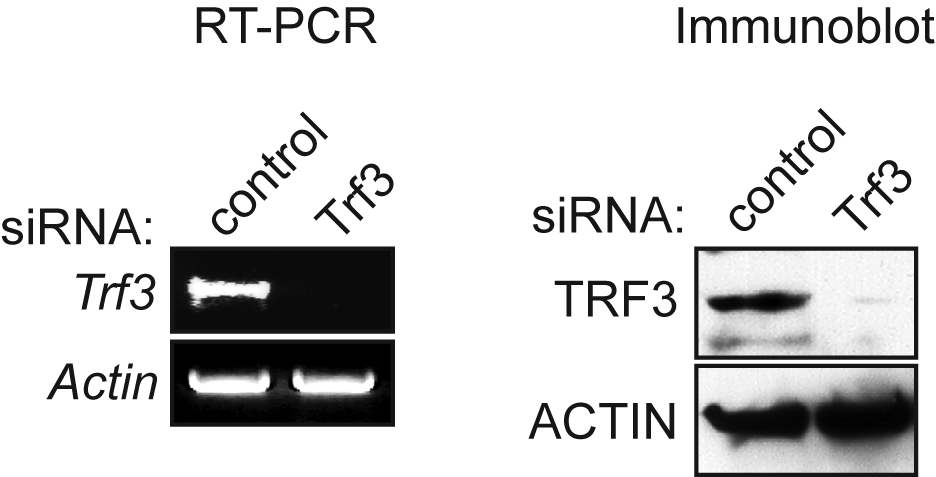
Fig. S6
Analysis of Trf3 expression in mouse embryonic stem cells following siRNA-mediated knockdown of Trf3. RT-PCR (left) and immunoblot (right) analysis monitoring Trf3 knockdown following treatment with a control (luciferase) or Trf3 siRNA. Actin was monitored as a loading control.
Acknowledgments
This image is the copyrighted work of the attributed author or publisher, and
ZFIN has permission only to display this image to its users.
Additional permissions should be obtained from the applicable author or publisher of the image.
Full text @ Dev. Dyn.