
Image
|
Figure Caption
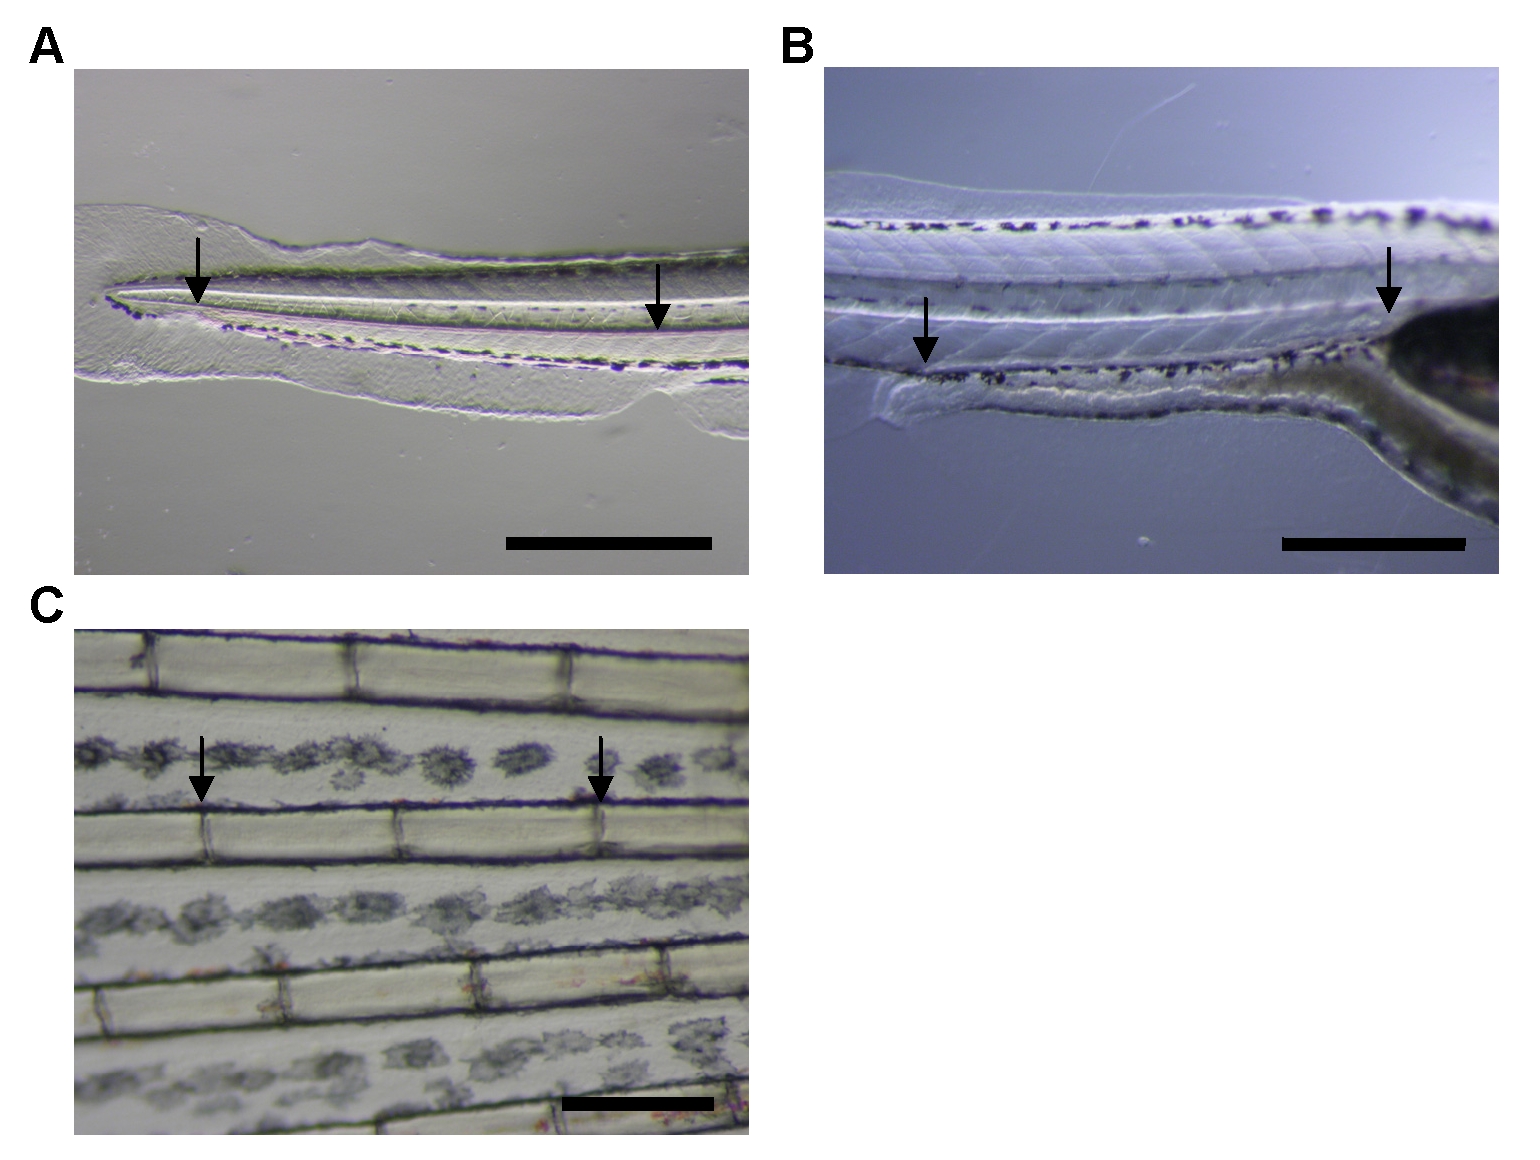
Fig. S1 Starting and ending locations for the red blood cell flow rate. Red blood cells were timed between the arrows shown in the pictures of a (A) day-5 post-fertilization zebrafish at day 5, (B) day-15 post-fertilization zebrafish at day 15 and 21, and (C) day 42 zebrafish caudal fin (fourth main ray from bottom) at day 42 and week 16; bar = 0.5 mm.
Acknowledgments
This image is the copyrighted work of the attributed author or publisher, and
ZFIN has permission only to display this image to its users.
Additional permissions should be obtained from the applicable author or publisher of the image.
Full text @ PLoS One