
|
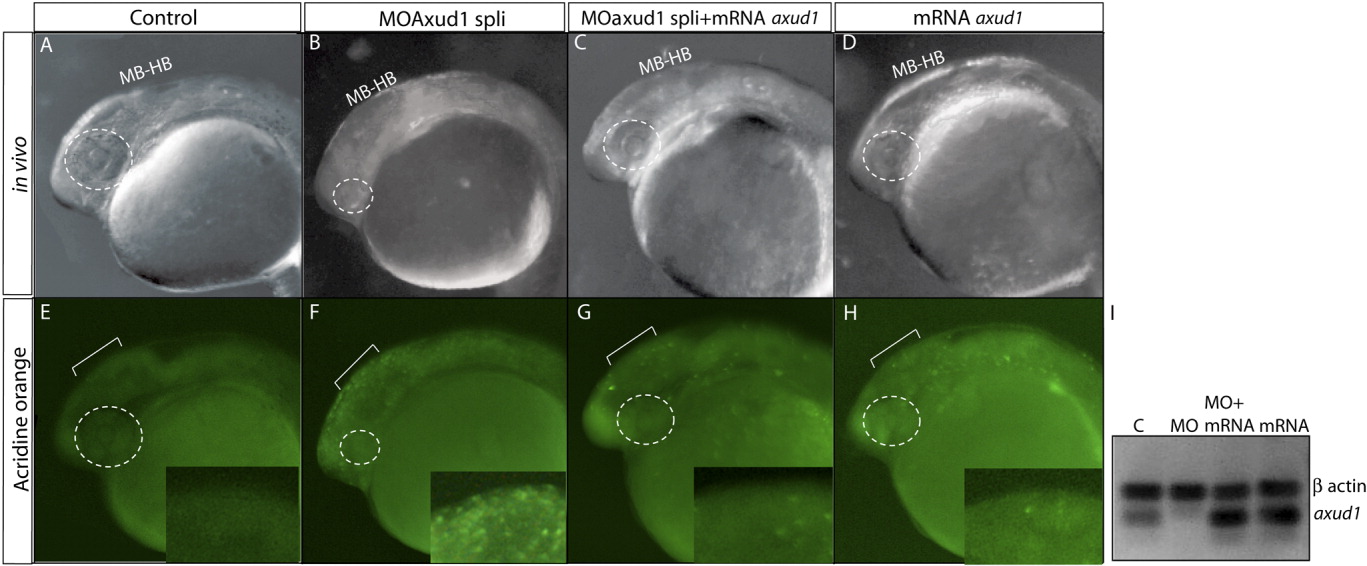
Fig. 5 Axud1 gain of function rescues the morphant phenotype. A-D: Live embryos. E-H: Acridine orange stain of the same embryos that are depicted in A-D. Insets show magnifications of the region encompassed by the brackets. A, E: Control embryos; no cell death is detected (E). B, F: Morphant embryos. Notice the drastic decrease in the eye size (B) and the extensive cell death in the midbrain region (F, bracket and inset). C, G: Splice morpholino and axud1 mRNA co-injection significantly rescue the head and eye size reductions and the cell death phenotype. D, H: The overexpression of Axud1 has no obvious phenotype. The phenotypes depicted in each panel correspond to representative embryos and the corresponding percentages are: 80% showing this phenotype in morphant embryos (n = 93), 60% of embryos show rescue (n = 87), and 100% of mRNA injected embryos appear normal (n = 96). I: RT-PCR showing the efficiency of the splice morpholino to block correct splicing of the axud1 transcript. cDNA was prepared from uninjected (“C”), co-injected with morpholino, and axud1 mRNA (“MO+mRNA”), or injected with axud1 mRNA (“mRNA”) embryos. The panel shows the internal control (β-actin, upper band) and the spliced axud1 mRNA (lower band). The absence of the axud1 band in MO-injected embryos (“MO”) indicates defective axud1 pre-RNA splicing. Note the strong axud1 band in embryos injected with the axud1 mRNA showing the presence of exogenous message. The bracket indicates the midbrain region and the dashed line indicate the eye. MB-HB, midbrain-hindbrain boundary. All panels are lateral views.