
Image
|
Figure Caption
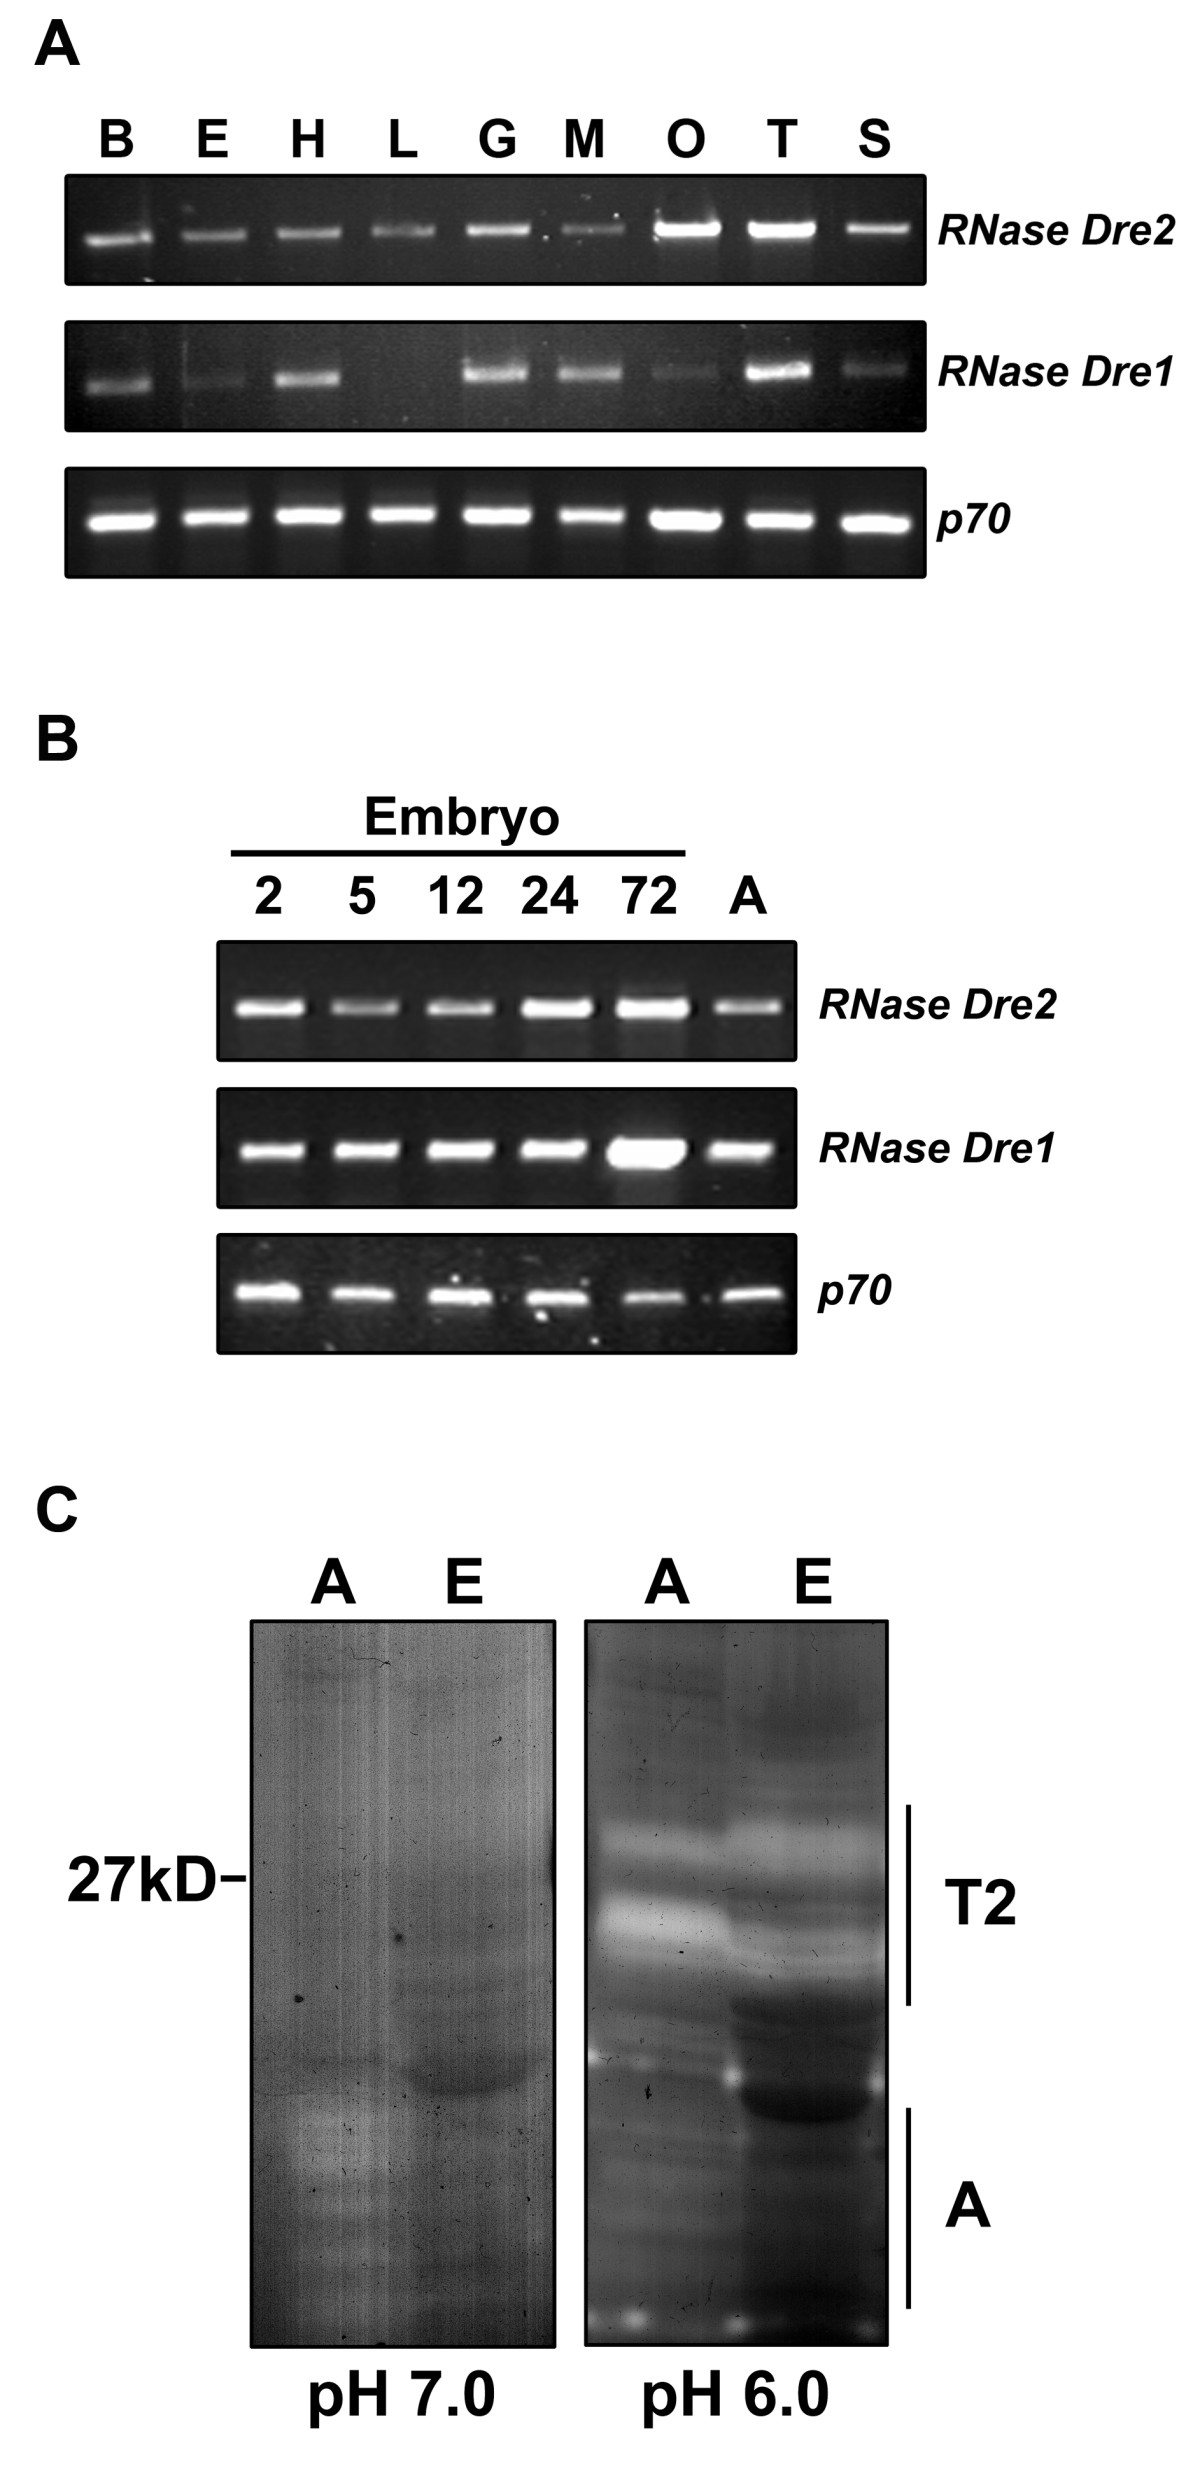
Fig. 3 Expression of zebrafish RNase Dre1 and RNase Dre2. A) RT-PCR analysis of expression of RNase Dre2 and RNase Dre1 in adult tissues: B, brain; E, eye; H, heart; L, liver; G, gut; M, muscle; O, ovary; T, testis; S, skin. p70 was used as control for loading. B) RT-PCR analysis of expression of RNase Dre2 and RNase Dre1 in embryos at different times (in days) after fertilization. C) Ribonuclease activities present in zebrafish embryos (E) and adults (A) analyzed by in gel activity assay as in Figure 1.
Figure Data
Acknowledgments
This image is the copyrighted work of the attributed author or publisher, and
ZFIN has permission only to display this image to its users.
Additional permissions should be obtained from the applicable author or publisher of the image.
Full text @ BMC Evol. Biol.