
Image
|
Figure Caption
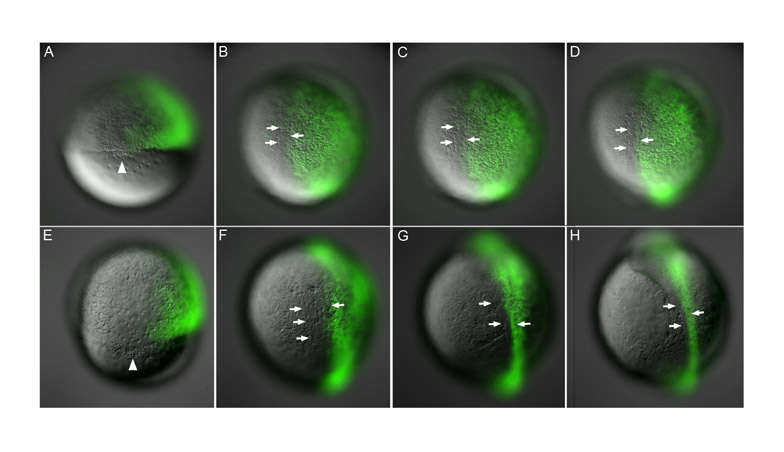
Fig. S1 Time-lapse of dorsal clones. (A-H) Still images of dorsolateral clones, lateral views. Arrowheads indicate dorsal midline and arrows indicate notochord boundaries. (A-D) gfp RNA-injected control embryo from shield (A) to 90% (D). (E-H) gsc RNA-injected embryo from 60% epiboly (E) to 2-somite stage (H).
Acknowledgments
This image is the copyrighted work of the attributed author or publisher, and
ZFIN has permission only to display this image to its users.
Additional permissions should be obtained from the applicable author or publisher of the image.
Full text @ Development