
|
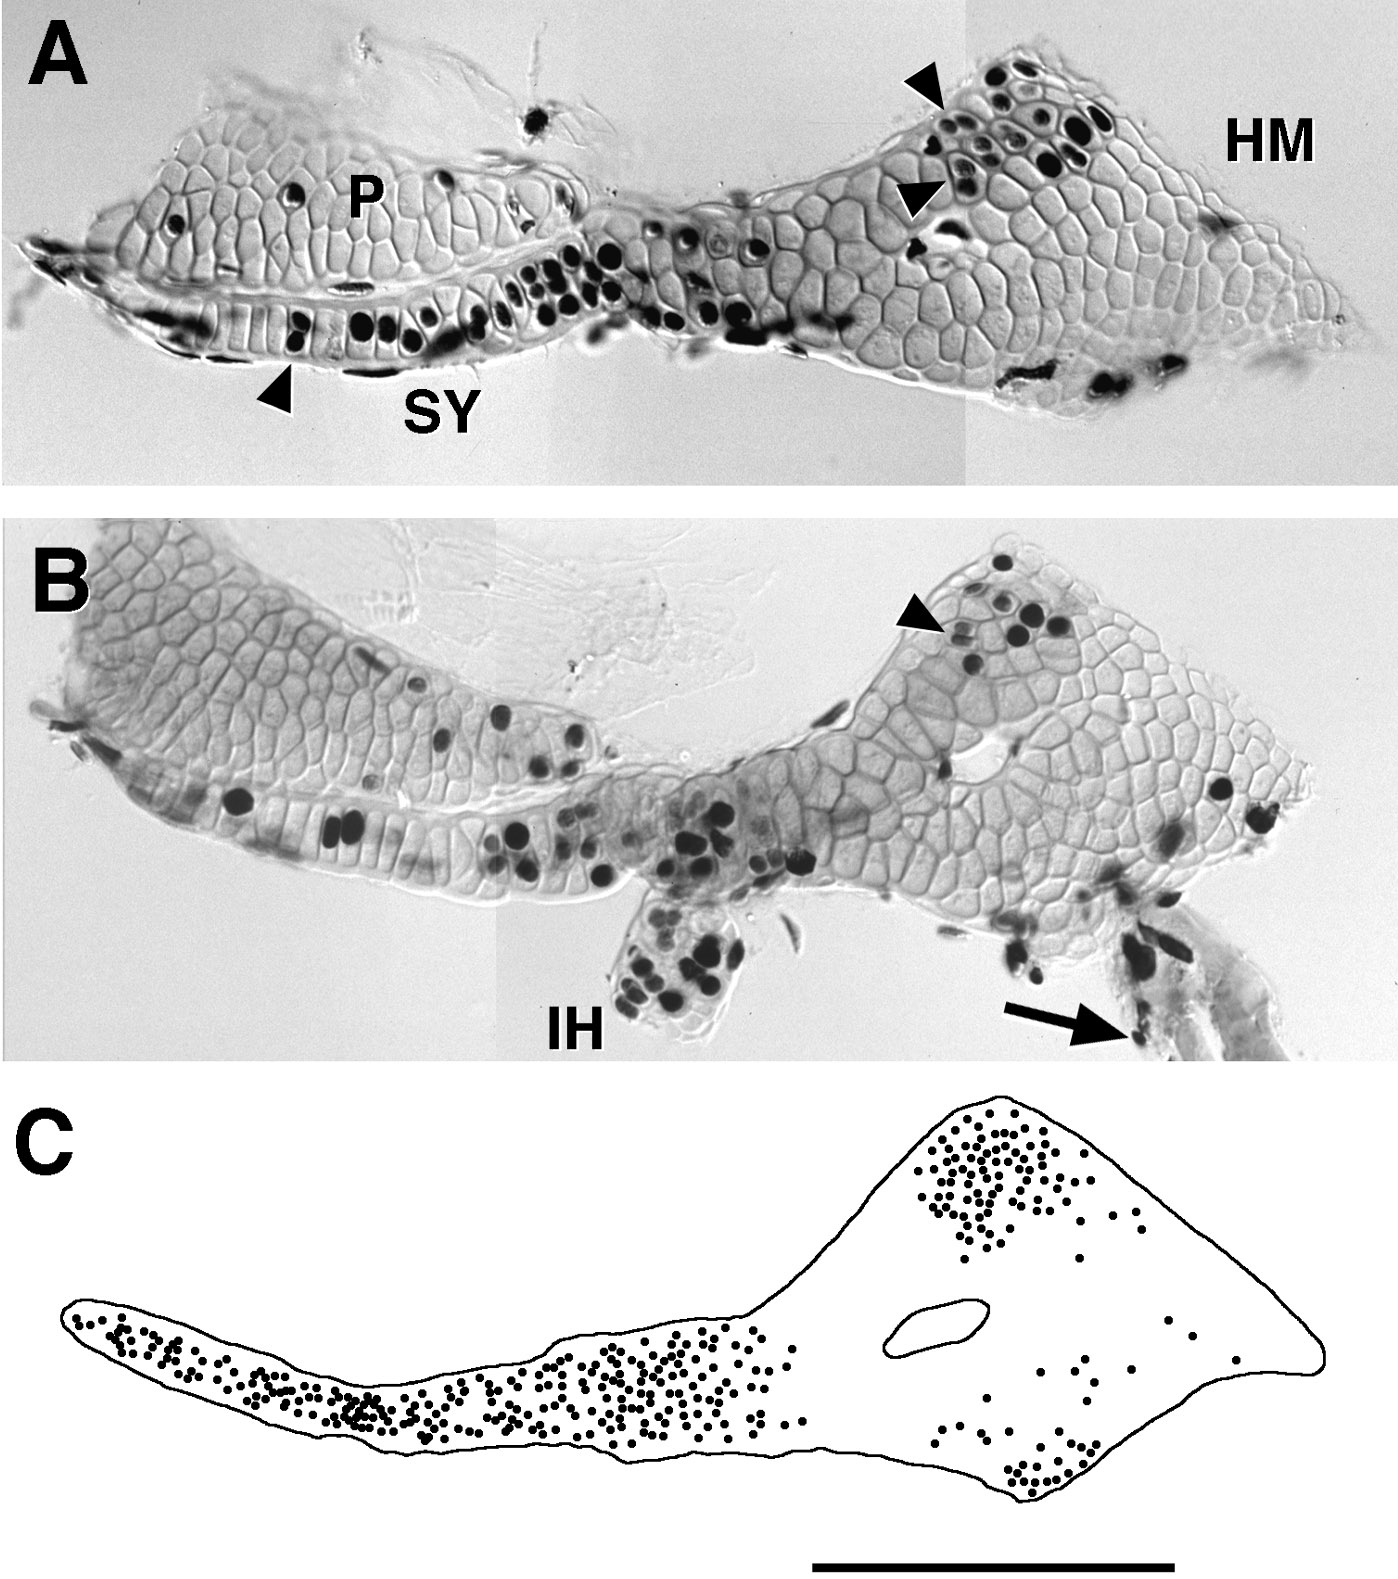
Fig. 8 Bromodeoxyuridine labeling of the growing HS. (A, B) Two examples at day 4.5, after exposure to BrdU for 1 day (and refreshed at 6-h intervals), counterstained with Alcian green. Labeled round-shaped nuclei are chondrocyte nuclei, whereas the thin elongated nuclei are of mesenchymal perichondrial cells. Arrowheads show examples of pairs of small labeled chondrocyte nuclei present together in a single lacuna, probably representing the pair of daughter cells stemming from a single mitosis that occurred during the day-long exposure. Examination with Nomarski optics confirms that the two nuclei are within separate cells that had not yet formed an intervening Alcian-positive matrix. We did not observe such pairs if the labeling time was less than 4 h, even though many single labeled nuclei were present (data not shown). This would mean that 4 h is about the minimal time that it takes for a chondrocyte captured by BrdU incorporation in the S phase of the cell cycle to have completed that cell cycle and divided (i.e., 4 h is approximately the length of the G2 + M phases of the cell cycle). In B labeling is also present in the IH and in cells overlying the forming opercular bone (arrow), which articulates with the HM’s ventral–posterior apex. (C) The location of every labeled chondrocyte nucleus in 12 cartilages, exposed to BrdU as in (A, B) is plotted on a single overlay, revealing that the distribution of labeling is markedly nonrandom. The central region of the HM is practically devoid of labeled chondrocytes, showing it to be a region where the cells are not dividing. Quantitative analyses (not shown) reveal that significantly more labeled cells occupy the region of the HM’s dorsal–anterior apex (to the top) than its posterior–ventral apex (to the bottom; P < 0.001; t test). This finding suggests that chondrocytes are dividing more rapidly in the dorsal–anterior apical region, since there is no difference in how tightly the cells are packed within the two regions. The IJ, the region of the HM adjacent to it, and the SY are also regions where cells appear to be dividing at a relatively high rate. Scale bar: 100 μm.
Reprinted from Developmental Biology, 203, Kimmel, C.B., Miller, C.T., Kruse, G., Ullmann, B., BreMiller, R.A., Larison, K.D., and Snyder, H.C., The shaping of the pharnygeal cartilages during early development of the zebrafish, 245-263, Copyright (1998) with permission from Elsevier. Full text @ Dev. Biol.