
|
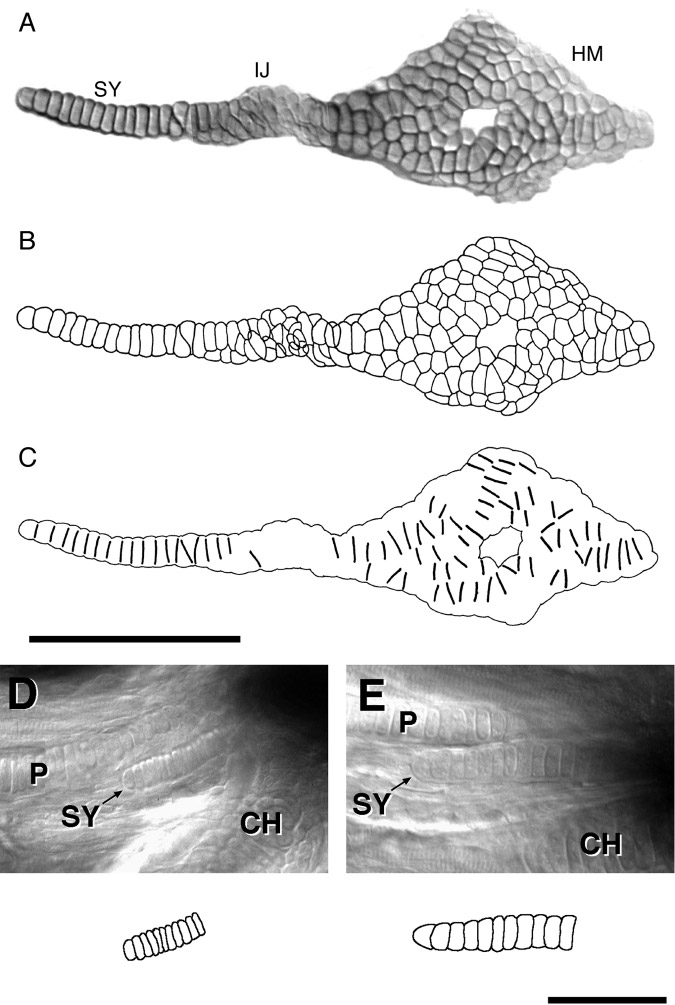
Fig. 2 Chondrocyte stacks in the young HS. (A–C) An Alcian blue-stained, dissected, and flat-mounted preparation at 3 days. The cells in the IJ are smaller and less brightly stained than elsewhere in the cartilage (shown in A), correlating with the fact that they are the last to chondrify (Schilling and Kimmel, 1997; see also Fig. 4). B shows that the IJ cells overlap considerably, in contrast to the SY and HM, where they are arranged within a single layer. They are aligned into a single row (a stack) in the anterior SY (to the left), where the cells are checker-shaped and have exactly two neighbors, ignoring the perichondrium. Closer to IJ the SY cells typically have more than 2 neighbors, as in this example. Stacked cell arrangements are also evident in the HM. The HM cells are polygonal; individual cells mostly have 5 or 6 neighbors. In C a side of a polygon is only drawn if it is noticeably longer than other sides, and if the apposition is with only a single adjacent cell. This presentation facilitates picking out the stacked cell arrangement in the HM; stacks are present where a row of long boundaries lie in parallel. The stacks run from left to right, along the long axis of the HM, and they also point upward toward the upper apex where a prominent joint is made with the chondrocranium (this apex is actually the HM’s dorsal–anterior apex since the cartilage is obliquely oriented in the animal, see Fig. 1A). Note that no stacks swing downward, in the opposite direction, to the posterior–ventral apex where a joint is made with the opercular bone. These features seem invariant, whereas detailed arrangements of the cells and stacks vary considerably among different examples at the same stage (including the pair of cartilages on the left and right sides of a single individual). Scale bar (A–C): 100 μm. (D, E) Nomarski views of the SY in a live embryo at 65 h and a live larva at 97 h postfertilization. The arrow points to the anterior end of the SY cartilage, its left end in the figure. The accompanying drawings outline SY cells, reconstructed from multiple focal plane Nomarski images. At the earlier stage (D) the cells are coin-shaped; within a few hours they plump into a puck-shape. By 97 h (E) the cells have enlarged considerably; the increase in area in the plane of view is about 2.7-fold. Scale bars (D, E): 50 μm.
Reprinted from Developmental Biology, 203, Kimmel, C.B., Miller, C.T., Kruse, G., Ullmann, B., BreMiller, R.A., Larison, K.D., and Snyder, H.C., The shaping of the pharnygeal cartilages during early development of the zebrafish, 245-263, Copyright (1998) with permission from Elsevier. Full text @ Dev. Biol.