
|
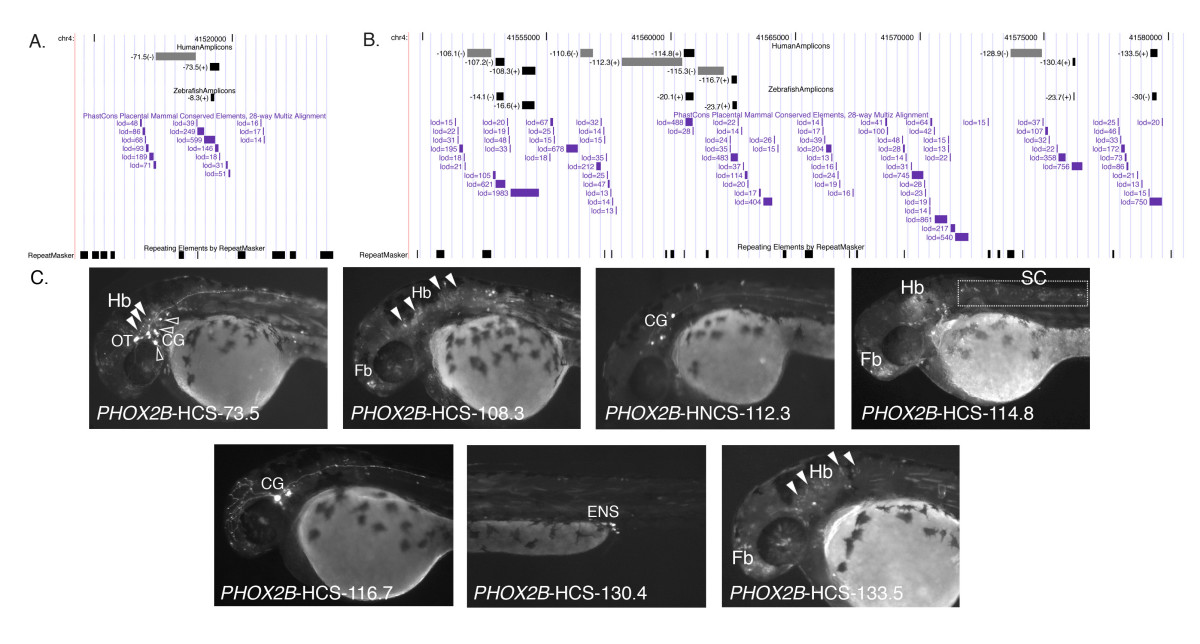
Fig. 2 PHOX2B human distal conserved sequences demonstrate activity consistent with orthologous zebrafish sequences. The interval displayed as a custom track on UCSC Genome browser [54]. The amplicons are represented as gray scale rectangles: black (conserved), gray (non-conserved), black (zebrafish alignment). (A) Region containing region aligning to phox2b-ZCS -8.3 (chr4:41,516,361–41,521,080; hg18) (B) Region containing aligning to phox2b-ZCS -16.6,phox2b-ZCS-20.1, phox2b-ZCS -23.7 and phox2b-ZCS-30.0. (chr4:41,549,434–41,580,142; hg18) (C) Lateral images of G0 transgenic zebrafish embryos corresponding to functional human conserved (PHOX2B-HCS -73.5, PHOX2B-HCS -108.3, PHOX2B-HCS-114.8, PHOX2B-HCS -116.7, PHOX2B-HCS -130.4 and PHOX2B-HCS-133.5), and human non-conserved (PHOX2B-HNCS -112.3) amplicons. Fb, Forebrain; OT, Oculomotor and Trochlear Motor Progenitors; Hb, Hindbrain; CG, Cranial Ganglia; SC, Spinal Cord; ENS, Enteric Nervous System. Closed arrow-heads point to hindbrain expression. Open arrow-heads point to cranial ganglia expression.