
|
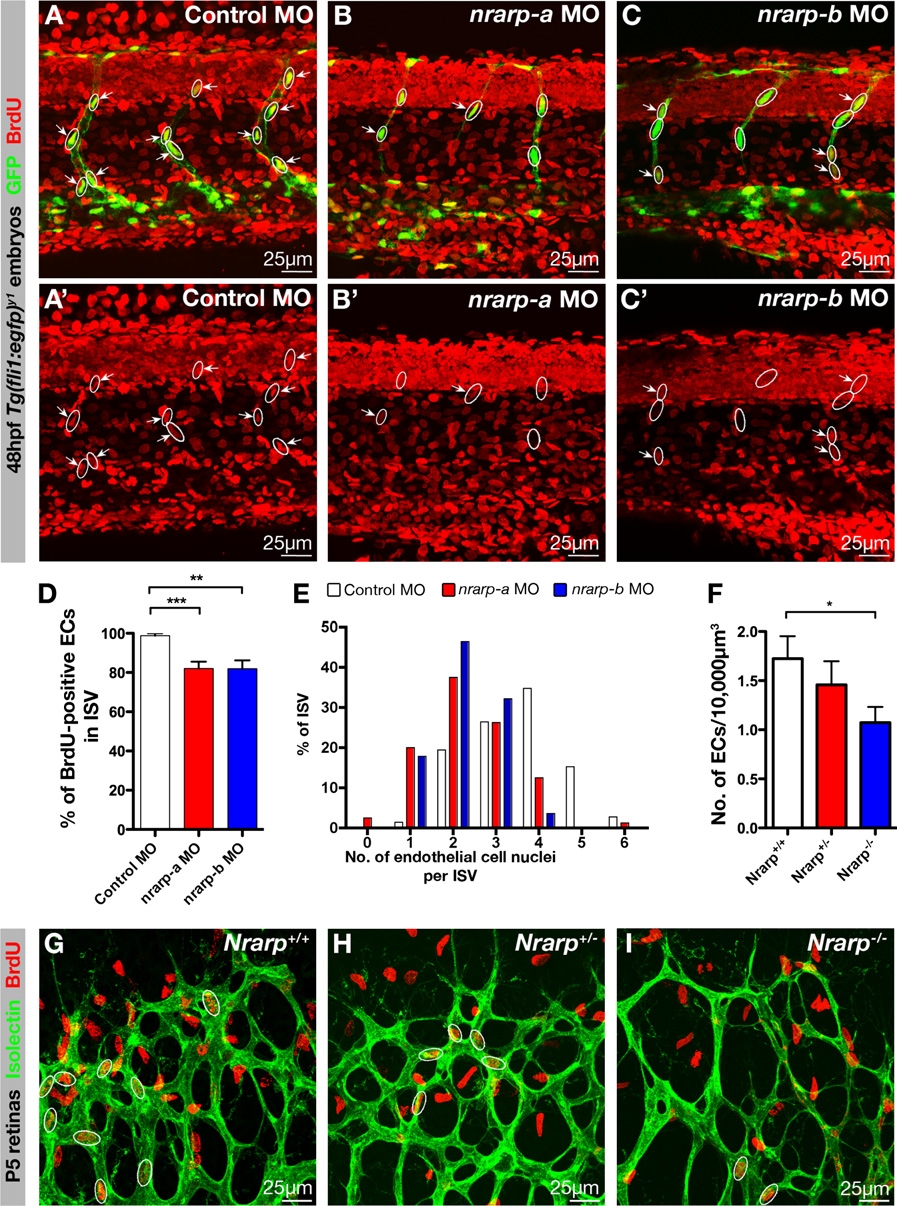
Fig. 5 Decreased EC Proliferation in Nrarp-/- Mouse and in nrarp-a and nrarp-b Morphants
(A–D) Control, nrarp-a and -b MO-injected Tg(fli1:EGFP)y1 zebrafish embryos were exposed to BrdU (red) from 19 to 48 hpf. Circles highlight ECs nuclei along ISVs. Arrows indicate BrdU-positive ECs. (D) Quantification of BrdU-positive ECs in ISVs. Error bars indicate SEM. Control, n = 8 (31 ISVs); nrarp-a, n = 6 (47 ISVs); nrarp-b, n = 14 (66 ISVs).
(E) Decrease in EC number in ISVs of nrarp-a and -b morphants. Bar graph shows the percentage of ISVs containing x number of endothelial nuclei per ISV at 48 hpf. Control MO, n = 17; nrarp-a MO, n = 16; nrarp-b MO, n = 21. Eight ISVs/embryo were analyzed.
(F–I) 3 hr BrdU incorporation assay in P5 mice. Bar graph shows number of proliferated ECs in 10,000μm3 retinal vessels (F). *, p = 0.0328. Nrarp+/+, n = 17, Nrarp+/-, n = 8; Nrarp-/-, n = 14 images. Data show mean ± SEM. (G–I) Circles highlight BrdU-positive ECs in Nrarp+/+, Nrarp+/-, and Nrarp-/- retinas stained with Isolectin-B4 (green) and BrdU (red).
Reprinted from Developmental Cell, 16(1), Phng, L.K., Potente, M., Leslie, J.D., Babbage, J., Nyqvist, D., Lobov, I., Ondr, J.K., Rao, S., Lang, R.A., Thurston, G., and Gerhardt, H., Nrarp coordinates endothelial Notch and Wnt signaling to control vessel density in angiogenesis, 70-82, Copyright (2009) with permission from Elsevier. Full text @ Dev. Cell