
|
Fig. S5
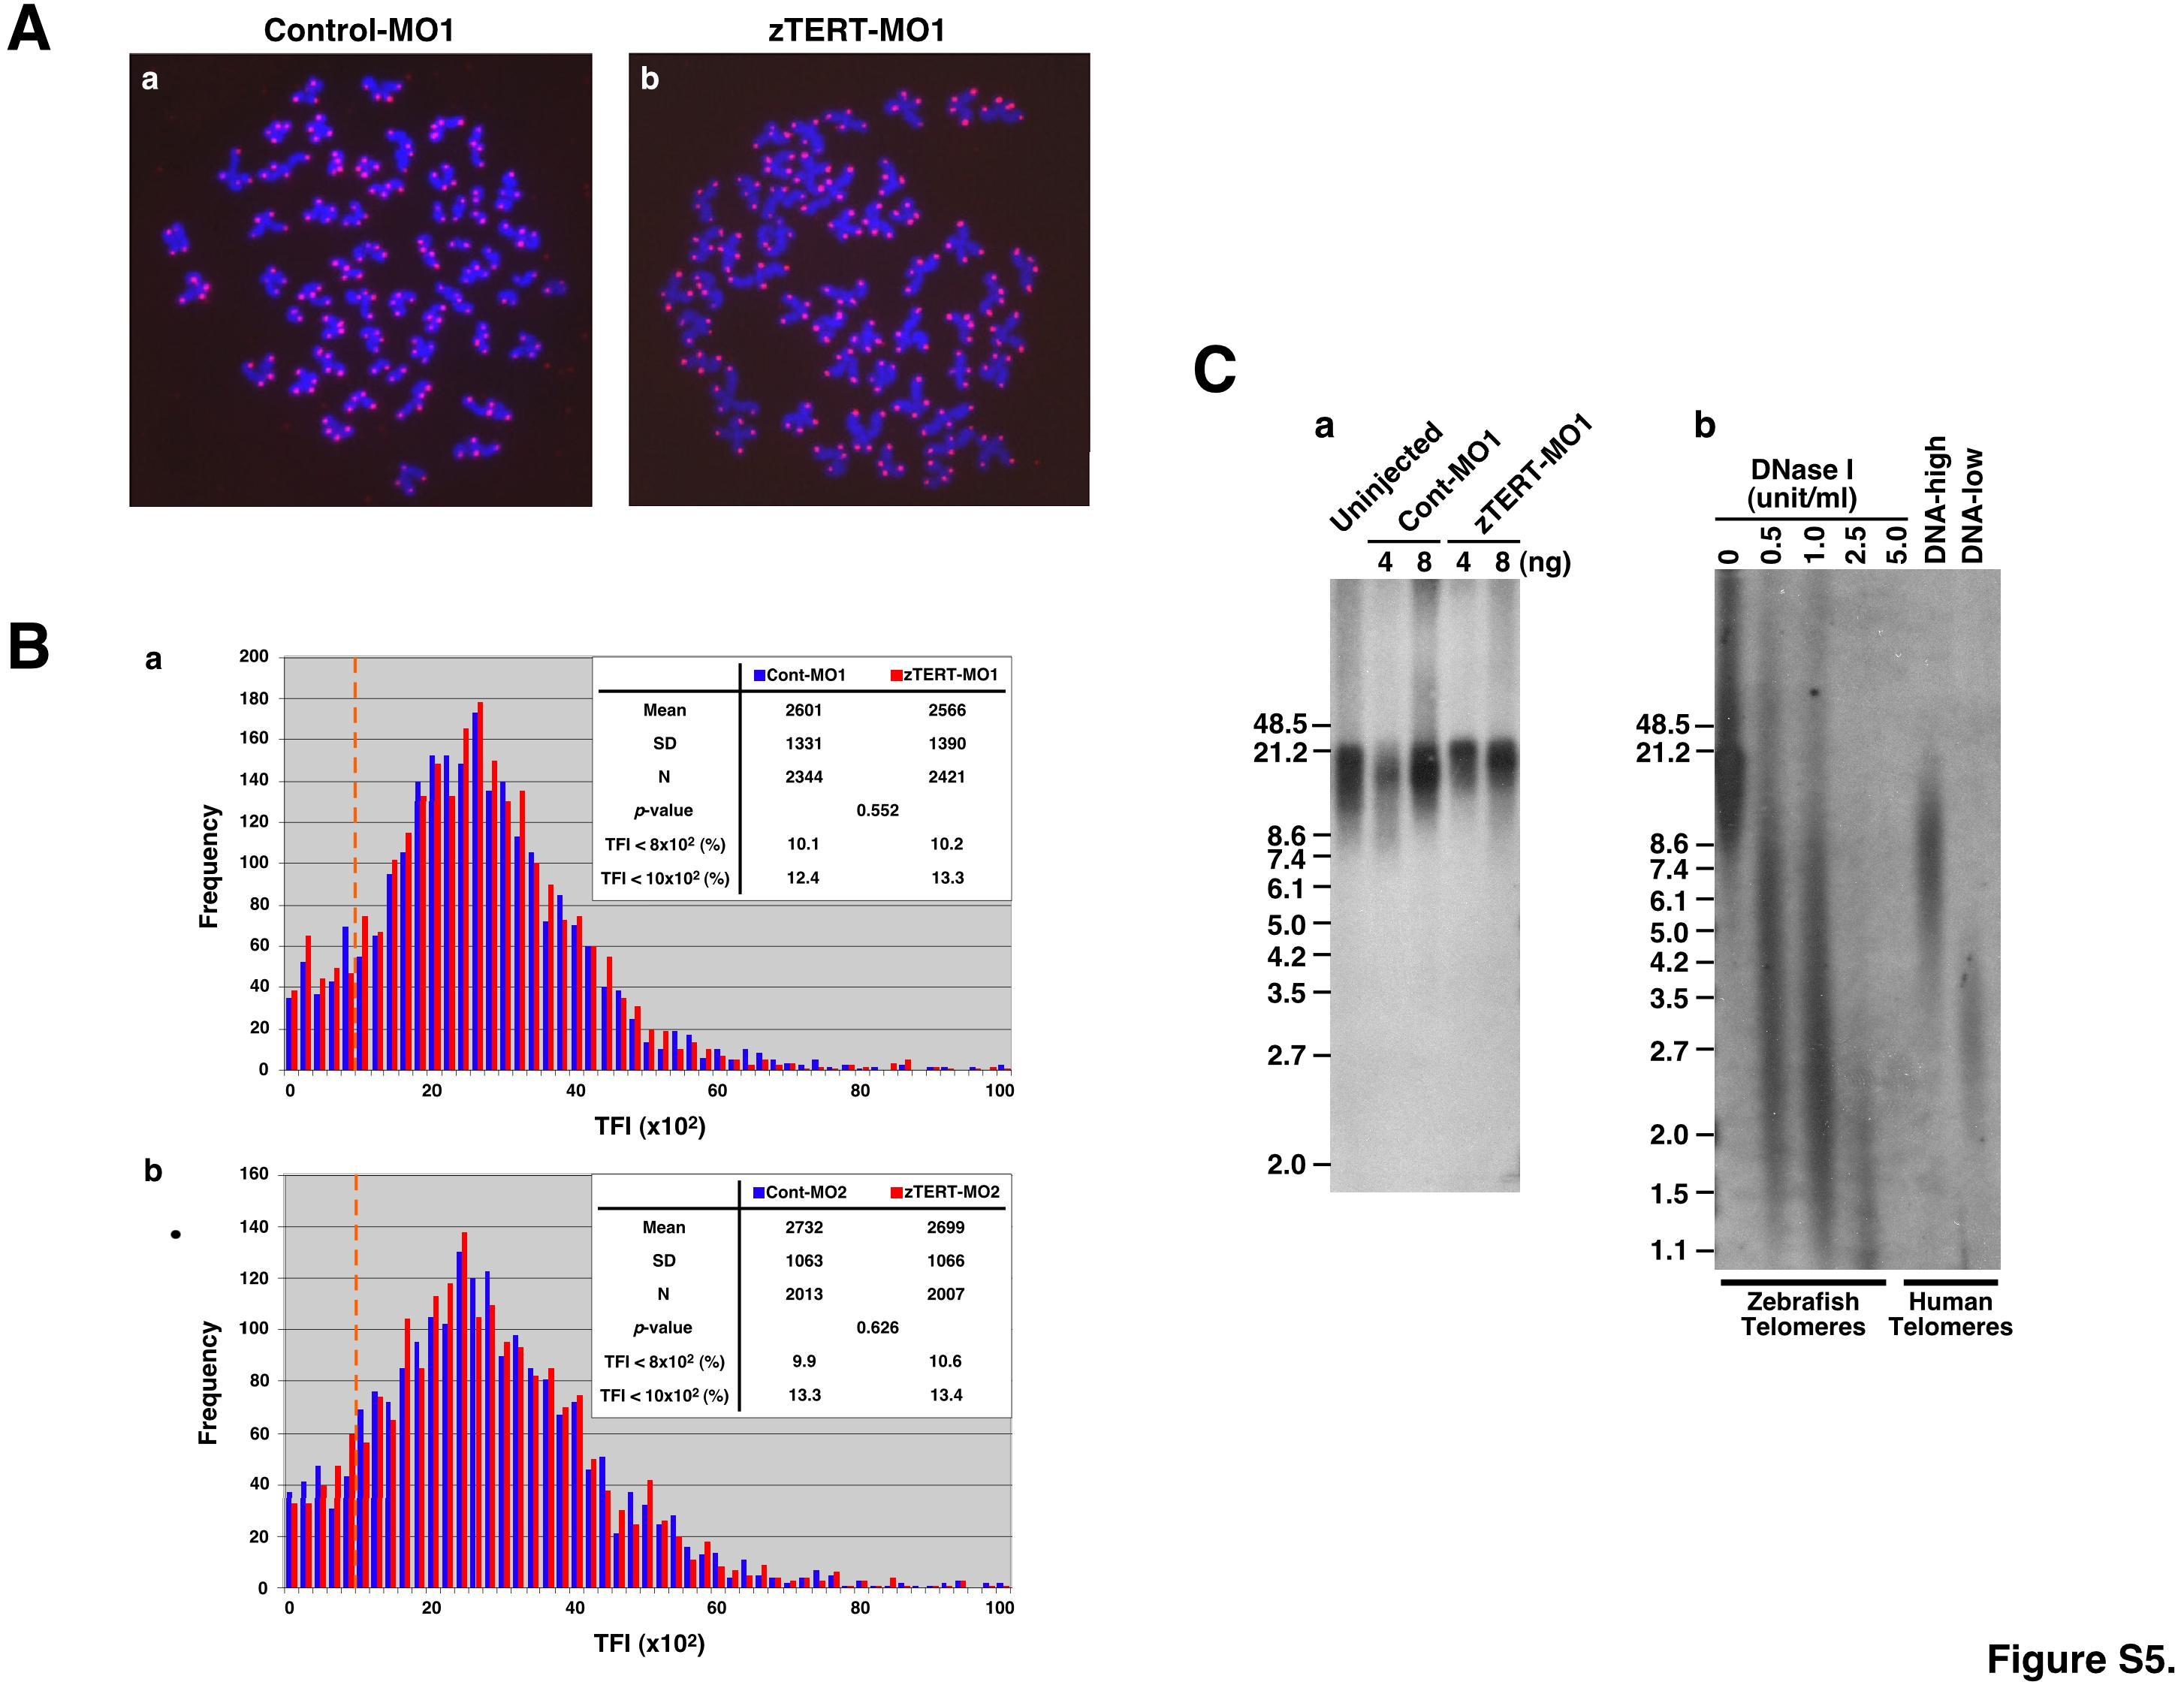
Analyses of Telomere length in zTERT morphants.
(A) Metaphase spreads from zebrafish embryos for quantitative telomere FISH (Q-FISH) analysis. Metaphase chromosomes from Cont-MO1-injected embryos (a), and zTERT-MO1-injected embryos (b), for telomere Q-FISH.
(B) Representative histograms showing the distribution of telomere lengths by telomere fluorescence intensity measurements of metaphase spreads from control and zTERT morphants (MO1 and MO2; 8 ng) at 24 hpf, as measured using the TFL-TELO software. Histograms of telomere Q-FISH for Cont-MO1 and zTERT-MO1 (a), and Cont-MO2 and zTERT-MO2 (b). The x-axis depicts the intensity of each signal as expressed in telomere fluorescence intensity units (TFU), and the y-axis shows the frequency of telomeres of a given intensity. The dashed orange line indicates 10 x 102 TFU.
(C) Telomeric restriction fragment (TRF) analysis of DNA isolated from either uninjected, Cont-MO1-, or zTERT-MO1-injected embryos (a) , and from zebrafish genomic DNA digested by DNase I in vitro and control human DNA (DNA-high and DNA-low) (b) .