
Image
|
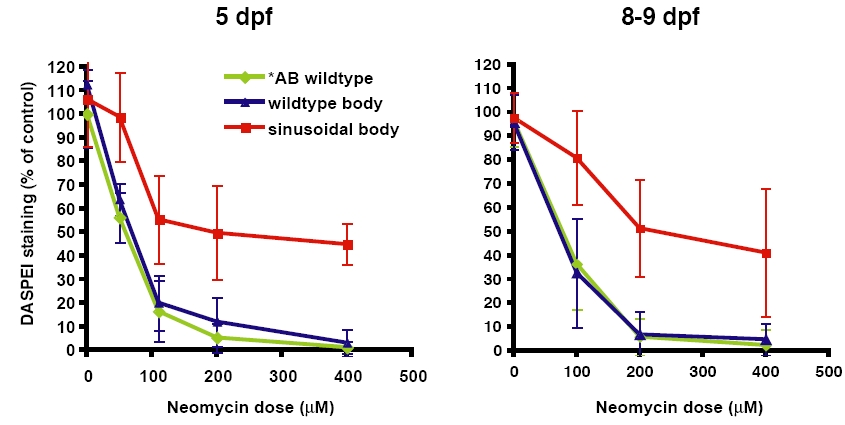
Figure Caption
Fig. S1 Comparison of the dose response curve of 5 dpf versus 8–9 dpf sentinel mutants. Hair cell staining by DASPEI was assessed after neomycin exposure among progeny of sentinel heterozygous parents with wildtype body shape (blue) or sinusoidal body shape (red). The dose response curves of wildtype *AB control fish are shown (green). (A) Dose-response at 5 dpf. (B) Dose-response at 8–9 dpf. Error bars are ±1 S.D.
Figure Data
Acknowledgments
This image is the copyrighted work of the attributed author or publisher, and
ZFIN has permission only to display this image to its users.
Additional permissions should be obtained from the applicable author or publisher of the image.
Full text @ PLoS Genet.