
|
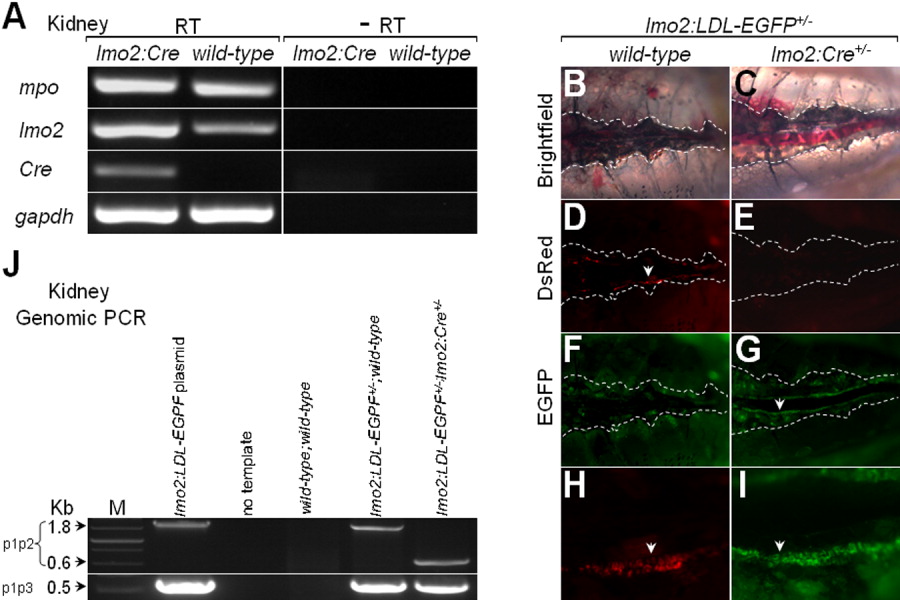
Fig. 7 Cre expression and activity in the kidney marrow of Tg(zlmo2:Cre) adult zebrafish. A: Detection of Cre expression by semi-quantitative RT-PCR. B-I: Cre activity in kidney marrow. The morphology of kidney marrows derived from lmo2:LDL-EGFP+/-;wild-type and lmo2:LDL-EGFP+/-;lmo2:Cre+/- fish is shown in B and C (dotted lines, head to the left). Detection of fluorescence in the kidney marrow of lmo2:LDL-EGFP+/-;wild-type (D and F), and lmo2:LDL-EGFP+/-;lmo2:Cre+/- fish (E and G). Amplified views of regions expressing red fluorescence (H) and green fluorescence (I), as shown in D and G, respectively. J: Detection of Cre-mediated recombination by genomic PCR in kidney marrow. Genomic PCR was performed using the same primer sets as shown in Figure 4A. The 0.6-kb recombinant fragment was amplified only from the kidney marrow of lmo2:LDL-EGFP+/-;lmo2:Cre+/- fish.