
Image
|
Figure Caption
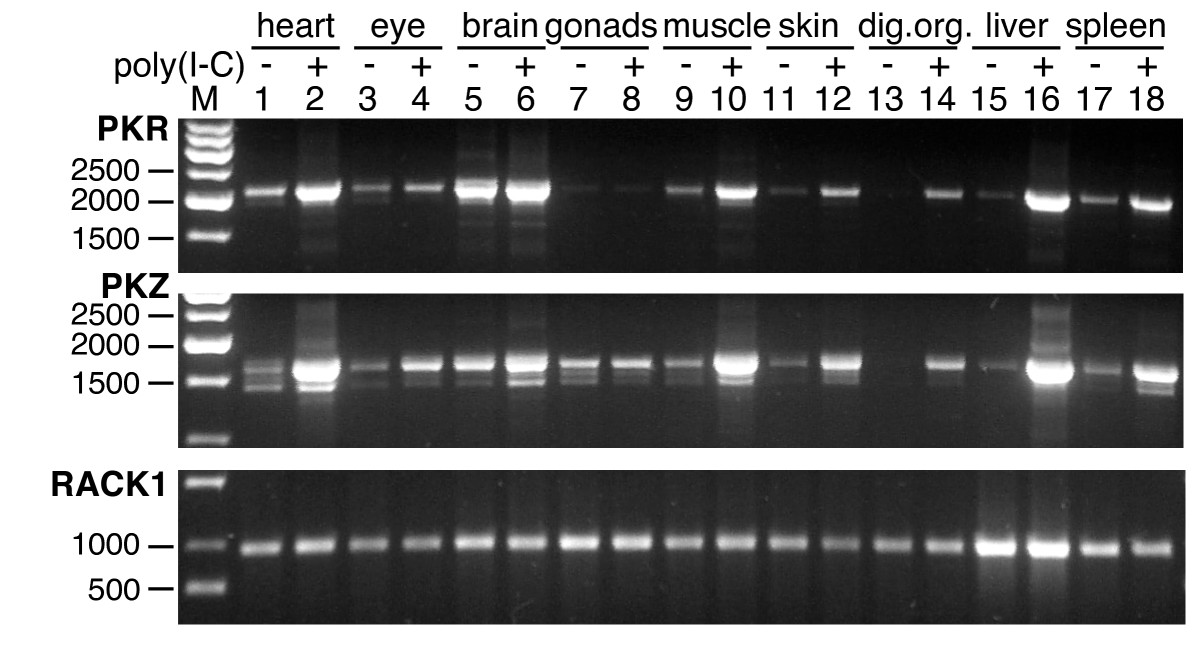
Fig. 3 Comparison of expression patterns of zebrafish PKR and PKZ after induction with poly(I:C). PCRs were performed with cDNA prepared from the indicated tissues with primers covering the complete ORFs of zebrafish PKR (upper panel), PKZ (middle panel) or RACK1, the latter of which is constitutively expressed and served as control (lower panel). Zebrafish were either treated with poly(I:C) (indicated by plus) or with PBS (minus).
Figure Data
Acknowledgments
This image is the copyrighted work of the attributed author or publisher, and
ZFIN has permission only to display this image to its users.
Additional permissions should be obtained from the applicable author or publisher of the image.
Open Access.
Full text @ BMC Biol.