
|
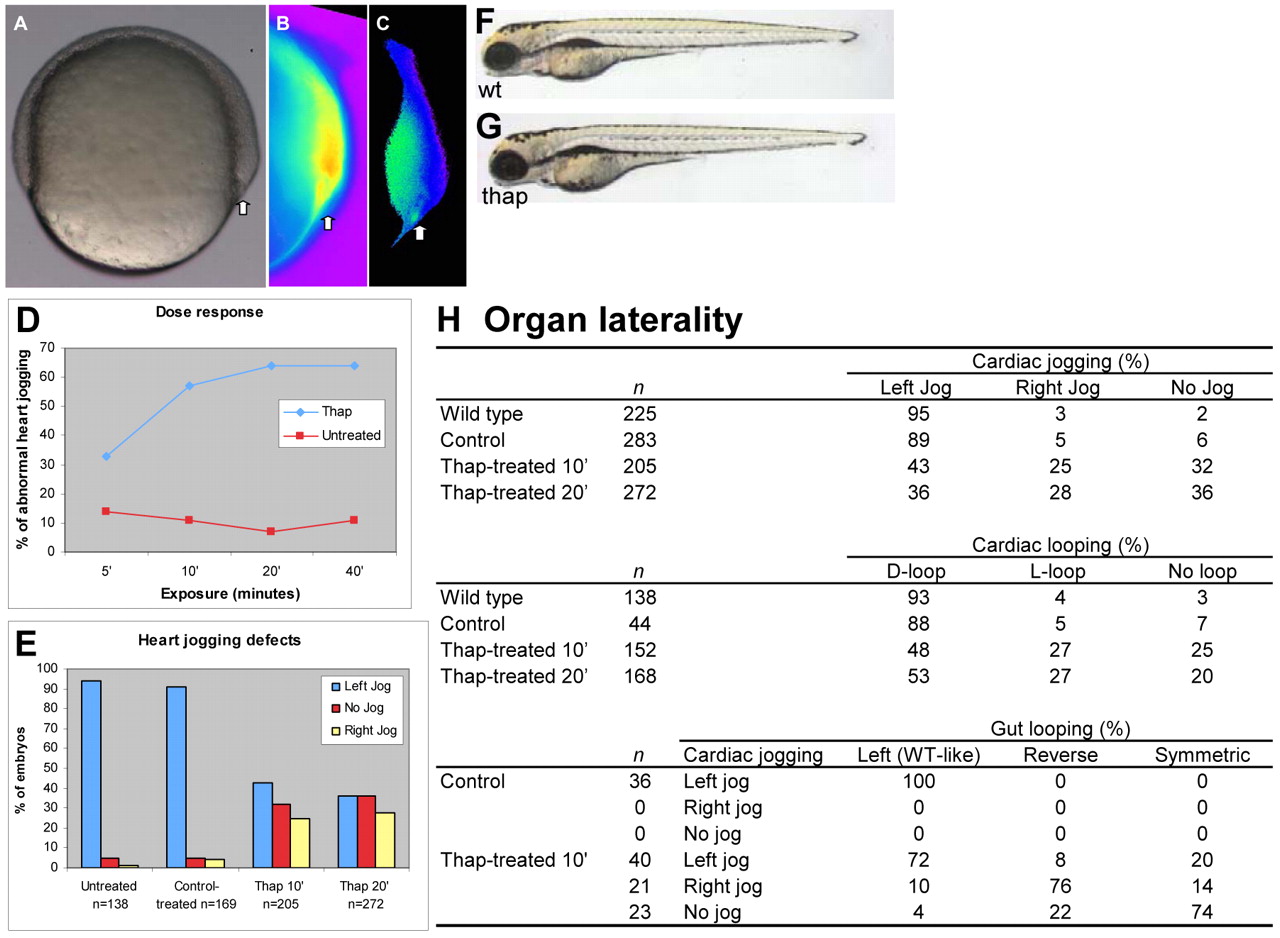
Fig. 1 Ca2+ manipulation impacts organ laterality. (A-C) Lateral view, dorsal to the right of 70-80% epiboly stage embryos with arrows indicating the DFC region in (A) bright field image, (B) an individual frame of Fura-2 (380) fluorescence and (C) the corresponding ratiometric image (340/380). The ratio image is converted to pseudo-color with yellow indicating high free intracellular Ca2+. (D) Summary plot of thapsigargin exposure vs heart jogging defects. (E) Summary of heart jogging defects in wt, control and after 10 and 20 minutes of thapsigargin treatment at 60% epiboly. Lateral view of wt (F) and thapsigargin-treated (G) embryos. (H) Summary of organ laterality defects. Thap, thapsigargin.