
Image
|
Figure Caption
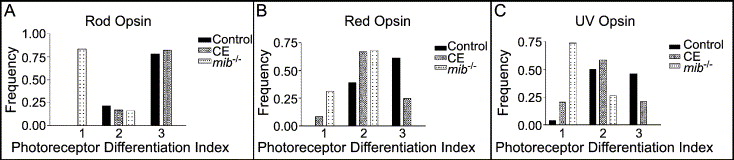
Fig. 2 Frequency histograms of the photoreceptor differentiation index. Levels of photoreceptor differentiation, as measured by opsin expression at 65 hpf in control, mib-/- and CE-treated retinas (See text for a description of the index). (A) Rod photoreceptor differentiation progressed normally in CE-treated retinas and controls, but was significantly slowed in mib-/- retinas (Table 2). (B) Red cone differentiation was slowed in CE-treated and mib-/- retinas compared to controls (Table 2). (C) UV cone differentiation was also slowed in CE-treated and mib-/- retinas compared to controls (Table 2).
Acknowledgments
This image is the copyrighted work of the attributed author or publisher, and
ZFIN has permission only to display this image to its users.
Additional permissions should be obtained from the applicable author or publisher of the image.
Reprinted from Developmental Biology, 278(2), Bernardos, R.L., Lentz, S.I., Wolfe, M.S., and Raymond, P.A., Notch-Delta signaling is required for spatial patterning and Muller glia differentiation in the zebrafish retina, 381-395, Copyright (2005) with permission from Elsevier. Full text @ Dev. Biol.