
|
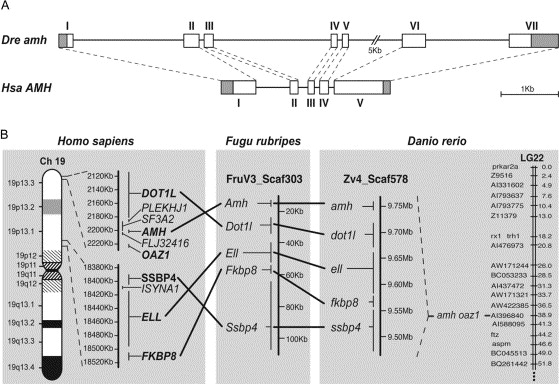
Fig. 1 Genomic analysis of zebrafish amh. (A) Comparison of exon-intron organizations of zebrafish amh (Dre) and human AMH (Hsa) genes. Exons are represented by numbered boxes, and grey areas indicate untranslated regions. The correspondence of intron-exon boundaries between zebrafish and human genes is indicated by dashed lines. Scale bar is 1 kb. (B) Schematic representation of the conserved synteny in the amh genomic regions of human, fugu and zebrafish. The zebrafish amh gene is on genomic scaffold Zv4_Scaf578, which contains the four neighbor genes (dot1l, ell, fkbp8 and ssbp4), and maps to LG22 together with the oaz1 gene. All these genes are contained in a single genomic scaffold of Fugu (FruV3_Scaf303), and all of them map to human chromosome 19p13.3-1.
Reprinted from Gene expression patterns : GEP, 5(5), Rodríguez-Marí, A., Yan, Y.L., Bremiller, R.A., Wilson, C., Cañestro, C., and Postlethwait, J.H., Characterization and expression pattern of zebrafish anti-Müllerian hormone (amh) relative to sox9a, sox9b, and cyp19a1a, during gonad development, 655-667, Copyright (2005) with permission from Elsevier. Full text @ Gene Expr. Patterns