
Image
|
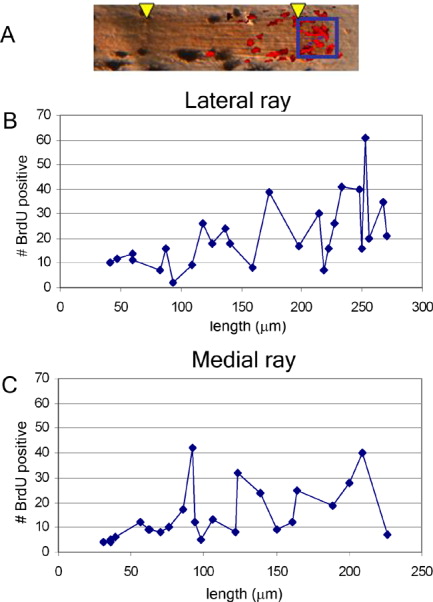
Figure Caption
Fig. 1 Cell proliferation during segment growth appears pulsatile. A: Overlayed images of ZNS5+ cells (osteoblasts) in brown and bromodeoxyuridine-positive (BrdU+) cells in red. Arrowheads indicate joints. BrdU+ cells distal to the most distal joint were counted (boxed region) from individual fin rays and plotted against the length of the ultimate segment from the same fin. B: Number of BrdU+ cells in the longest fin ray in the ventral lobe. C: Number of BrdU+ cells in the shortest fin ray in the fin. Each data point in B and C represents a single fin ray. N = 28 rays.
Acknowledgments
This image is the copyrighted work of the attributed author or publisher, and
ZFIN has permission only to display this image to its users.
Additional permissions should be obtained from the applicable author or publisher of the image.
Full text @ Dev. Dyn.