
|
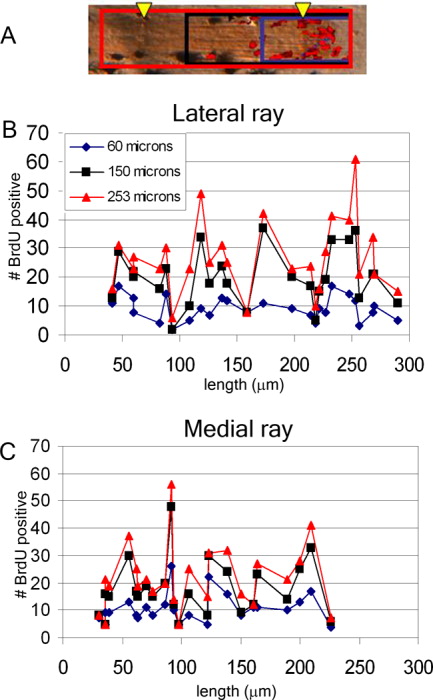
Fig. 2 Cells proximal to the most distal joint appear to contribute to segment growth. A: Overlayed images of ZNS5+ cells (osteoblasts) in brown and bromodeoxyuridine-positive (BrdU+) cells in red. Arrowheads indicate joints. BrdU+ cells were counted from three areas: 60 μm from the end of the fin (blue box), 150 μm from the end of the fin (black box), 250 μm from the end of the fin (red box); and plotted against the length of the ultimate segment in B and C. B: BrdU+ cells counted in each of the three areas, from the longest fin ray in the ventral lobe. C: BrdU+ cells counted in each of the three areas, from the shortest fin ray in the fin. Each data point in B and C represents a single fin ray. N = 28 rays.