
|
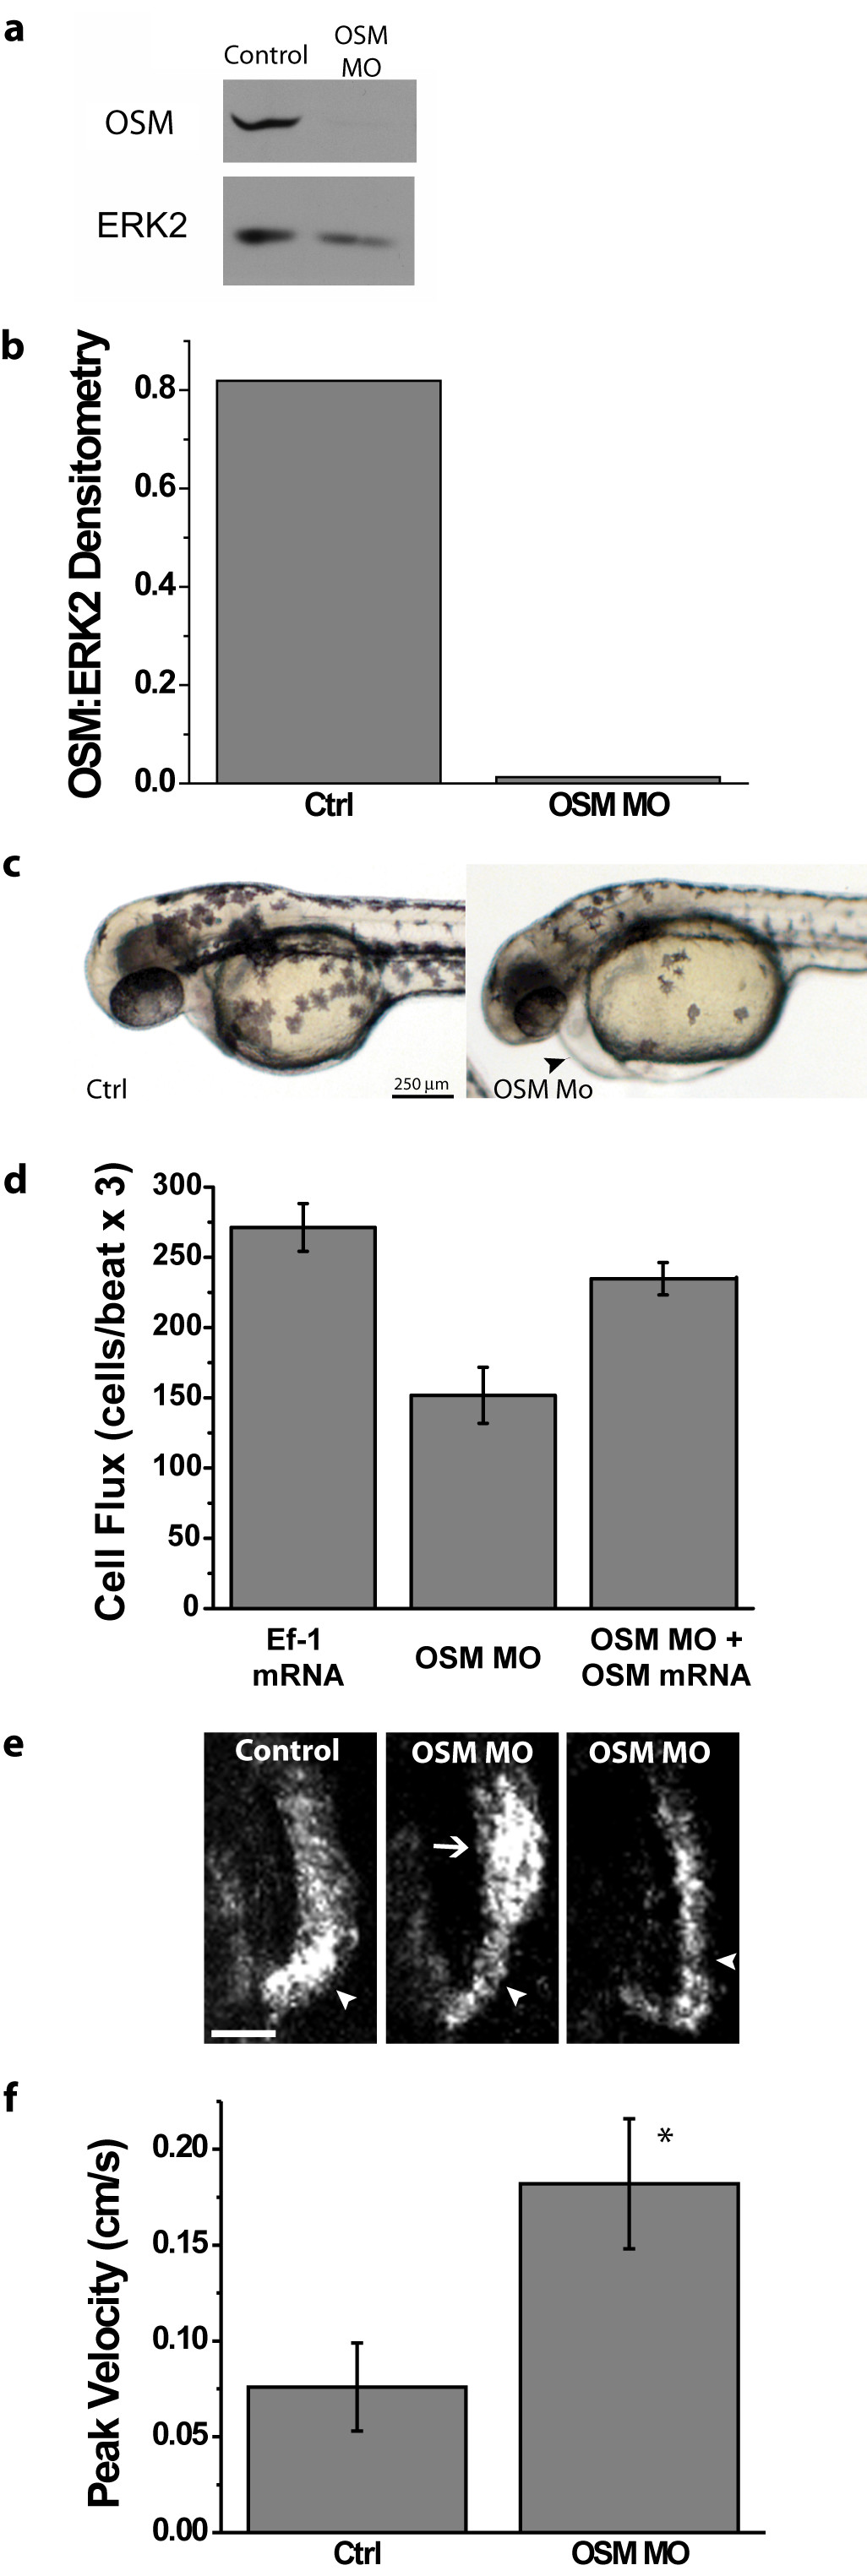
Fig. 4 Laser-scanning velocimetry provides functional evidence for the presence of an aortic arch constriction in OSM-deficient embryos. (a) Western blotting for OSM in lysates from control or OSM morpholino-injected embryos harvested at 48 hpf shows nearly complete repression of OSM expression. The abundance of ERK2 is shown as a loading control. (b) Intensity of OSM bands normalized to ERK2 by densitometry for western blots shown in Panel a. (c) OSM morphant embryos at 48 hpf exhibited pericardial edema (arrowhead). (d) Co-injection of OSM mRNA along with OSM morpholino restored cell flux to levels similar to that of control embryos. Cell flux was quantified by scan lines drawn perpendicular to the dorsal aorta above the cloaca. Error bars represent the SEM, n = 3. (e) In silico microangiography of the aortic arch (arrowheads) at 28 hpf shows constricted flow through this region of the outflow tract in OSM-deficient embryos. A region of post-stenotic dilation (arrow), the result of turbulent flow, is occasionally observed. Scale bar is 25 μm. (f) Peak blood cell velocity, measured by laser-scanning velocimetry is increased in OSM-deficient embryos. Error bars represent SEM. Asterisk denotes p = 0.0017 for the two-tailed Student's T-test, n = 3. OSM morpholino #1 was used for the data presented here. Laser-Scanning Velocimetry Data Analyzer smoothing parameters used for trace, velocity, and acceleration smoothing were 5, 10, and 20, respectively.