
IMAGE
Fig. 2
- ID
- ZDB-IMAGE-070702-6
- Genes
- Publication
- Shimada et al., 2006 - Changes in gravitational force cause changes in gene expression in the lens of developing zebrafish
- All Figures
- Figures for Shimada et al., 2006
Image
|
Figure Caption
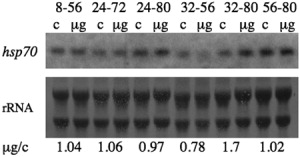
Fig. 2 Effect of simulated microgravity on hsp70 mRNA expression. After the exposure to simulated microgravity, 3 µg of total RNA samples from the embryos of each control group (C) and experimental group (mg) were loaded on each lane and Northern blot analysis for hsp70 mRNA was performed (upper panel). To confirm the integrity of RNA and the transfer efficiency, ribosomal RNAs on a nylon membrane stained with methylene blue are shown in the lower panel. The numbers on the bottom indicate the normalized densitometry of each group. This experiment was performed in triplicate.
Figure Data
Acknowledgments
This image is the copyrighted work of the attributed author or publisher, and
ZFIN has permission only to display this image to its users.
Additional permissions should be obtained from the applicable author or publisher of the image.
Full text @ Dev. Dyn.