
|
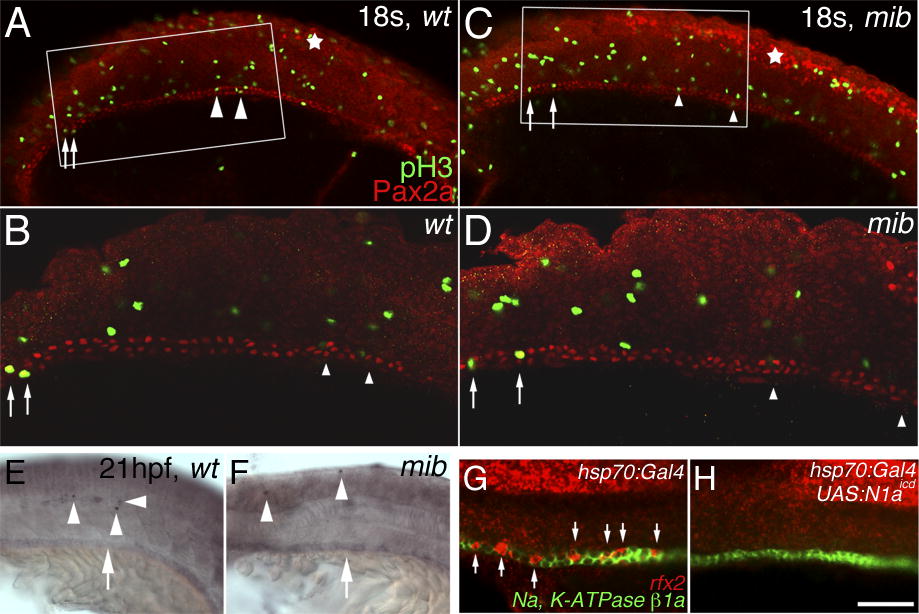
Fig. 7 Notch-Dependent Binary Choice between Multi-Cilia cells and Principal Cells in the Pronephric Duct(A–D) double antibody staining of Pax2a (red) and phospho-histone-3 (pH3, green) of 18 ss (A and B) wt embryos and (C and D) mibta52b mutants. In (A) and (C), some pH3-positive nuclei seem to overlap with Pax2a-positive nuclei in the pronephric duct (arrows and arrowheads). Higher magnification of the distal duct domain marked by the white box of the same (B) wt embryo and (D) mibta52b mutant revealed that the pH3-positive nuclei indicated by arrowheads are not found in pronephric duct, while the nuclei indicated by arrows are overlapping with Pax2a-positive nuclei. A 3-D reconstruction of the domain revealed that the nuclei are not overlapping with Pax2a-positive nuclei (Videos S1 and S2). Pax2a staining in the neural tube (asterisk) indicates the neurogenic phenotype in (C) mibta52b mutants compared to that of (A) wt embryos. Three wt embryos and four mibta52b mutants were examined. In addition, three wt embryos and three mibta52b mutants were sectioned, and all sectioned slices were examined. No proliferating cells were found in the duct domain (unpublished data). (E and F) Apoptosis assay with TUNEL method on (E) wt embryos and (F) mibta52b mutants at 21 hpf. TUNEL staining was found in the somite and neural tube (arrowheads), while TUNEL staining was not found in the pronephric duct (arrows). The brown staining in the duct is background staining. Ten wt embryos and five mibta52b mutants were examined. (G and H) Fluorescent double in situ hybridization of rfx2 (red) and Na+, K+ ATPase β1a (green) in 24-hpf embryos demonstrated that multi-cilia cells interpolate principal cells in (G) heat-shocked hsp70:Gal4 control embryos, while in (H) heat-shocked hsp70:Gal4/UAS:myc-notch1a-intra embryos, Na+, K+ ATPase β1a expression is robustly found in the duct cells but rfx2 is not. Arrows point to rfx2-expressing cells. (A–D) are anterior to the right; (E–H) are anterior to the left. Bar scale: 100 μm (A and C), 50 μm (B and D), 100 μm (E and F), and 50 μm (G and H).