
|
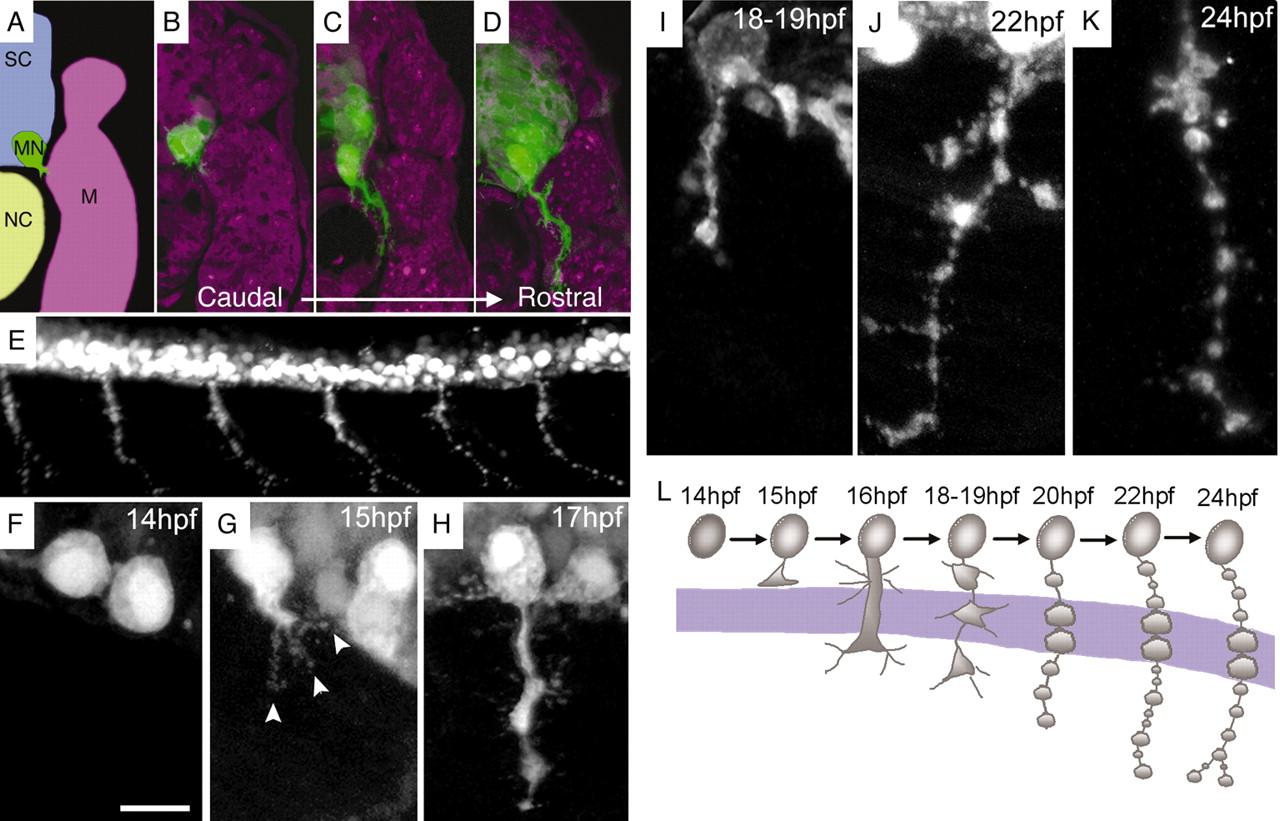
Fig. 1 Outgrowth of the CaP axon. (A-D) Cross-sections through a 20 hpf HB9-GFP fish counterstained with Neurotrace-435/455. (A) Position of the spinal cord (SC), motoneurons (MN), notochord (NC) and myotome (M). (B-D) Caudal (B), central (C) and rostral (D) segments illustrating extension of the CaP motor axon between the notochord and the ventral myotome. Multiple stages are seen in one fish because of the rostrocaudal developmental gradient. (E) Lateral view of six segments from an HB9:GFP fish at 24 hpf, showing the labeling of segmentally arranged primary motor axons. (F-K) Time-course of outgrowth in rostral segments. Motoneurons were present at 14 hpf (F). They began to extend processes tipped by filopodia (arrowheads) by 15 hpf (G), and formed stocky axons by 17 hpf (H). Initially large varicosities at 18 hpf (I) became interspersed with smaller varicosities by 22 hpf (J); varicosities become more uniform in size by 24 hpf (K). Axons were labeled by GFP in HB9:GFP fish (A-H,J) or by the znp-1 antibody in wild-type fish (I,K). (L) Schematic of CaP axon outgrowth (not to scale). Lavender band indicates the position of cells that are, or will become, muscle pioneers. Scale bar in F: 10 µm for F-K.