
-
- Expression (18)
- Figure (9)

| Publication: | Opposite effects of Activin type 2 receptor ligands on cardiomyocyte proliferation during development and repair |
|---|---|
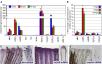
| Caption: | Expression analysis for TGF-β family genes and generation of mstnb GOF and inhbaa LOF lines. (a) RT–qPCR for mstnb, tcf21 (wall-specific), nppa (trabecular-specific) and hey2 (wall-specific) expression in Laser micro dissected wall and trabecular tissues from adult zebrafish heart sections (n=3 hearts assessed in 2 technical replicates). (b) RT–qPCR for TGF-β family ligand gene expression at 6 dpci compared to sham injured hearts (n=2 x 3 cardiac ventricles assessed as 2 biological and 2 technical replicates). (c) RT–qPCR for TGF-β family receptor gene expression at 6 dpci compared to sham injured hearts (n=2 x 3 cardiac ventricles assessed as 2 biological and 2 technical replicates). (d) Schematic representation of CM-specific mstnb OE transgene, Tg(myl7:mstnb-2A-H2B-EGFP). (e) Heart of 72 hpf mstnb OE larva in Tg(myl7:nlsDsRedExpress) background (native fluorescence). (f) Section of mstnb OE adult heart in Tg(myl7:nlsDsRedExpress) background; α-DsRed (red), α-GFP (green). (g) RT–qPCR for mstnb expression analysis in wild-type sibling and mstnb OE adult hearts (n=2 x 3 cardiac ventricles assessed as 2 biological and 2 technical replicates). (h- k) mstnb OE adult hearts and Hematoxylin and Eosin (H&E) staining of heart sections show no apparent abnormalities. (l-n) inhbaa TALEN designed to target TGF-β propeptide domain encoded by exon 1 was generated (l), a 17 bp frameshift deletion (inhbaabns37) was identified (m) and is predicted to cause the formation of truncated Inhbaa (n). Red number indicates the last native amino acid before the frameshift mutation; green number indicates the last amino acid before stop codon. (o) RT–qPCR for inhbaa expression analysis in inhbaa+/+ and inhbaa-/- adult hearts (n=2 x 3 cardiac ventricles assessed as 2 biological and 2 technical replicates). (p-s) inhbaa-/- adult hearts and H&E staining of heart sections show no apparent abnormalities. (data are mean ± s.e.m., ns: no significant changes observed, *P ≤ 0.05, **P ≤ 0.01 and ****P ≤ 0.0001 - Student’s t-test, two-tailed). Scale bars, 100 μm. vent., ventricle; atr., atrium; dpf, days post fertilization; mpf, months post fertilization. |

| Publication: | Nodal/Bozozok-independent induction of the dorsal organizer by zebrafish cell lines |
|---|---|
| Caption: | Induction of the dorsal organizer is unrelated to Activin signaling. (A) Expression of activin in each cell line by RT-PCR. activinβA was detected in the ZE6-1, ZE24-1, ZE120-1 cell lines, and Sertoli cell lines (ZtA6-6, ZtA6-12-1) and activinβB was detected in the ZE6-1 cell line and Sertoli cell lines (ZtA6-6, ZtA6-12-1). (B, D, F) Unimplanted; (C, E, G) ZE6-1 implanted embryos. (B, C) Embryos injected with lefty1. Secondary axis induced in the lefty1-injected embryos (C; 18 of 19 embryos, ZE6-1). (F, G) Whole-mount in situ hybridization for lefty1. We observed no ectopic expression of lefty1 in implanted embryos (G; n = 23). (B, C) Lateral views at 24 hpf. (D–G) Animal pole views at 6 hpf. e, eye of secondary axis; o.v., otic vesicle of secondary axis; t, tail of secondary axis. Arrowhead indicates the cell implants. The large arrows in G indicate the secondary axis. Scale bar, 100 μm. |

| Gene: | inhbb |
|---|---|
| Conditions: | control |
| Stage: | Adult |
| Expression: |
|
| Fish: | AB |
| Gene: | inhbb |
|---|---|
| Conditions: | standard conditions |
| Stage: | Gastrula:Shield |
| Expression: | |
| Fish: | TU |
| Gene: | inhbb |
|---|---|
| Conditions: | standard conditions |
| Stage: | Blastula:1k-cell |
| Expression: | |
| Fish: | TU |
| Gene: | inhbb |
|---|---|
| Conditions: | standard conditions |
| Stage: | Adult |
| Expression: | |
| Fish: | TU |
| Gene: | inhbb |
|---|---|
| Conditions: | standard conditions |
| Stage: | Adult |
| Expression: | |
| Fish: | WT |
| Gene: | inhbb |
|---|---|
| Conditions: | standard conditions |
| Stage: | Adult |
| Expression: | |
| Fish: | WT |
| Publication: | Activin-betaA Signaling Is Required for Zebrafish Fin Regeneration |
|---|---|
| Caption: | actβA Is Markedly Increased during Fin Regeneration in Comparison to Other Candidate Genes (A) Quantification of expression levels of alk4 and Alk4/5/7 ligands normalized to ubiquitously expressed β-actin1 and β-actin2 reference genes in amputated fins at 0 hpa (n = 3), 6 hpa (n = 4), and 24 hpa (n = 4). The normalized gene expression (NGE) values were calculated with the Pfaffl method and multiplied by a factor of 10,000. squint, cyclops, southpaw, TGFβ2, GDF8, and GDF11 have very low NGE values, indicating that they are not significantly expressed in fins. Error bars indicate the SEM, and n refers to the number of biological samples; each sample was prepared from 15–20 fins. (B) n-fold change in NGE in regenerating fins at 6 hpa and 24 hpa (test samples) relative to cut fins at 0 hpa, which as a calibrator sample were normalized to 1.00. alk4 displays nearly 2-fold induction in fins at 6 and 24 hpa; actβA is the only Alk4/5/7 ligand significantly upregulated during fin regeneration. Error bars indicate the SEM. (C–E) In situ hybridization of fins at 24 hpa. Each panel shows a fragment of a whole-mount (left) and a longitudinal section through the ray (right). In this and subsequent figures, the fins are oriented with the distal edge up. alk4 mRNA (purple) is weakly ubiquitously expressed with upregulation in the blastema (arrows) and the disorganized mesenchyme; "b" indicates bones, "e" indicates epidermis, "m" indicates mesenchyme, "we" indicates wound epidermis, and "bl" indicates blastema (C). actβB mRNA is detected in the entire epidermis (D). No labeling was detected with a squ mRNA antisense probe (E). |
| Publication: | Inhibition of the TGFβ Pathway Enhances Retinal Regeneration in Adult Zebrafish |
|---|---|
| Caption: | In situ hybridization with activin A and B as well as tgfβ1a, 2 and 3 antisense probes in zebrafish after the induction of retinal degeneration by MNU. Expression of these genes was detected beginning at day 1 and peaking at day 5. The highest staining intensity was observed for tgfβ3 and activins A and B, whereas only modest staining was observed for tgfβ1a and 2. These ligands were primarily detected in the inner nuclear layer (INL). The scale bar indicates 50 μm. GC: ganglion cells, ONL: outer nuclear layer. |
| Gene: | inhbb |
|---|---|
| Conditions: | control |
| Stage: | Adult |
| Expression: | |
| Fish: | AB |
| Gene: | inhbb |
|---|---|
| Conditions: | standard conditions |
| Stage: | Adult |
| Expression: | |
| Fish: | AB |
| Gene: | inhbb |
|---|---|
| Conditions: | standard conditions |
| Stage: | Adult |
| Expression: | |
| Fish: | WT |
| Publication: | Loss of Inhibin Advances Follicle Activation and Female Puberty Onset but Blocks Oocyte Maturation in Zebrafish |
|---|
| Publication: | Loss of Inhibin Advances Follicle Activation and Female Puberty Onset but Blocks Oocyte Maturation in Zebrafish |
|---|
| Gene: | inhbb |
|---|---|
| Conditions: | chemical treatment by environment: N-methyl-N-nitrosourea |
| Stage: | Adult |
| Expression: | |
| Fish: | AB |
| Gene: | inhbb |
|---|---|
| Conditions: | cold damage: heart |
| Stage: | Adult |
| Expression: | |
| Fish: | WT |