
- Title
-
A genetic modifier links integrin α5 to the phenotypic variation in fibronectin 1a mutant zebrafish
- Authors
- Capon, S.J., Maroufidou, A., Feltes, M., Xu, Y., Matharoo, D.K., Jülich, D., Holley, S.A., Farber, S.A., Stainier, D.Y.R.
- Source
- Full text @ PLoS Genet.

|

|
|
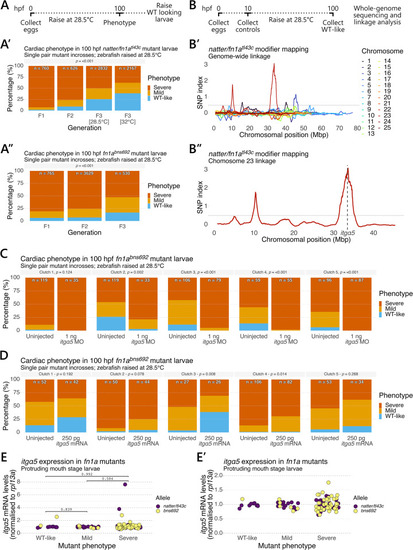
A genetic modifier links (A) Outline of the breeding scheme to select |