
- Title
-
Surrogate GPR139 Agonists Reverse Short-Term Startle Habituation Impairment in Larval Zebrafish
- Authors
- Kow, T.F., Mok, S.Y., Tang, P.Y., Chong, L.H., Ogawa, S.
- Source
- Full text @ FASEB J.

Spontaneous swimming test of larvae treated with various concentrations of GPR139 agonists. (A, B, and C) Kruskal–Wallis comparison between larvae treated with JNJ-63533054 (abbreviated as JNJ) in various concentrations and the control (0.1% DMSO) on (A) distance travel (millimeter, mm), (B) turn angle (degree), and (C) velocity (millimeter over second, mm/s). (D, E, and F) Kruskal–Wallis comparison between larvae treated with TAK-041 (abbreviated as TAK) in various concentrations and the control on (D) distance travel, (B) turn angle, and (C) velocity. ns indicates statistically non-significant. |
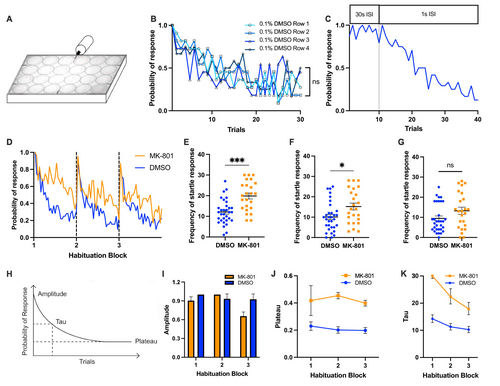
Startle habituation paradigm setup and validation using MK-801-induced habituation impairment model. (A) The setup of startle habituation paradigm. The row of well closest to the solenoid was Row 1 and the furthest away was Row 4. (B) Probability of response of the larvae treated with 0.1% DMSO (same as the control) in different row position. (C) Probability of response of startle trials that transitioned from 30s interstimulus interval (ISI) to 1 s ISI. Gray dotted line separated the transition. (D) Probability of response of larvae treated with MK-801 (orange, abbreviated as MK) and in the control (blue). (E, F, and G) Mann–Whitney U test of startle frequency between the MK group and the control group in first, second, and third block of startle habituation, respectively. (H) Reference model of one-order exponential decay curve fit and the visualization of the extraction of amplitude, tau, and plateau parameters. (I, J, K) Using the first-order exponential decay curve analysis, the probability of startle response for each block and each group (the control and the MK group) was fitted to the mathematical model with different constraints to independently generate amplitude, plateau and tau values (see Method). Amplitude, plateau and tau of the exponential curve for the control and MK groups based on the respective probability of response. Horizontal bars represent mean and error bars represent SEM, except for K, in which the error bars represent 95% confidence interval. *** indicates p < 0.001, * indicates p < 0.05, and ns indicates non-significant difference. |
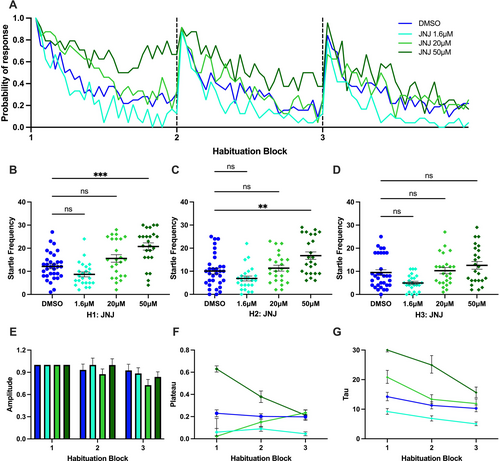
Effect of JNJ-63533054 (abbreviated as JNJ) on startle habituation in larval zebrafish. (A) Probability of response of larvae treated with various concentrations of JNJ and the control in three habituation blocks. (B, C, D) Kruskal–Wallis test followed by Dunn's multiple comparison test on startle frequency of larvae treated with various concentrations of JNJ and the control in first, second, and third habituation blocks, respectively. (E, F, G) Amplitude, plateau and tau of the exponential curve for various concentrations of the JNJ group and the control group. Horizontal bars represent mean and error bars represent SEM, except for G, in which the error bar represents 95% confidence interval. *** indicates p < 0.001, ** indicates p < 0.005, and ns indicates non-significant difference. |
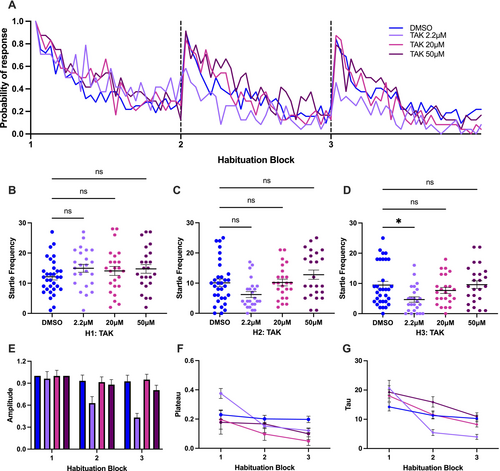
Effect of TAK-041 (abbreviated as TAK) on startle habituation in larval zebrafish. (A) Probability of response of larvae treated with various concentrations of TAK and the control in three habituation blocks. (B, C, D) Kruskal–Wallis test followed by Dunn's multiple comparison test on startle frequency of larvae treated with various concentrations of TAK and the control in first, second, and third habituation blocks, respectively. (E, F, G) Amplitude, plateau and tau of the exponential curve for various concentrations of the TAK groups and the control group. Horizontal bars represent mean, and error bars represent SEM, except for G, in which the error bars represent 95% confidence interval. * indicates p < 0.05, and ns indicates non-significant difference. |
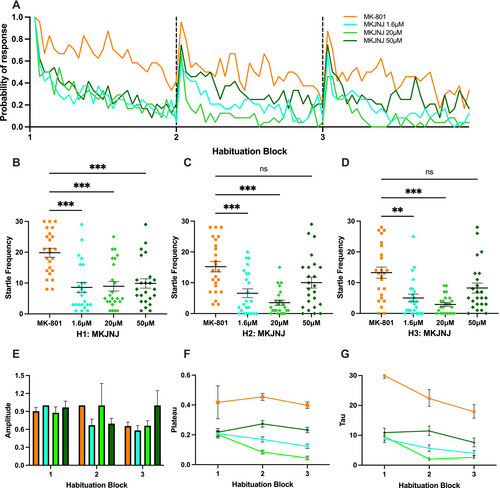
Effect of JNJ-63533054 on MK-801-induced larval zebrafish in startle habituation paradigm. (A) Probability of response of MK-801-induced larvae treated with various concentrations of JNJ-63533054 (abbreviated as MKJNJ) and MK-801-treated (abbreviated as MK) groups in three habituation blocks. (B, C, D) Kruskal–Wallis test followed by Dunn's multiple comparison test on startle frequency of MKJNJ group in first, second, and third habituation blocks, respectively. (E, F, G) Amplitude, plateau and tau of the exponential curve for various concentrations of the MKJNJ group and the MK group. Horizontal bars represent mean, and error bars represent SEM, except for G, in which the error bars represent 95% confidence interval. *** indicates p < 0.001, ** indicates p < 0.005, and ns indicates non-significant difference. |
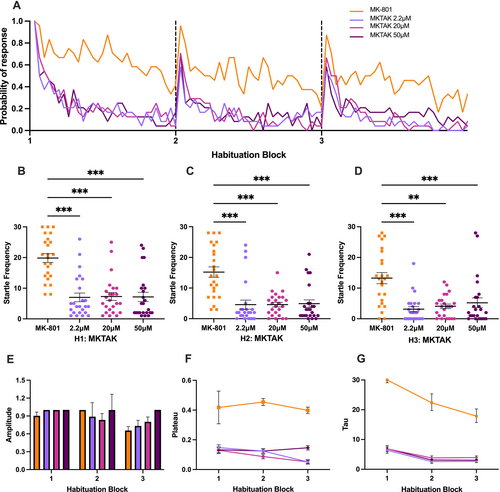
Effect of TAK-041 on MK-801-induced larval zebrafish in startle habituation paradigm. (A) Probability of response of MK-801-induced larvae treated with various concentrations of TAK-041 (abbreviated as MKTAK) and the MK group in three habituation blocks. (B, C, D) Kruskal-Wallis test followed by Dunn's multiple comparison test on startle frequency of MK-801-induced larvae treated with various concentrations of TAK and the MK group in first, second, and third habituation blocks, respectively. (E, F, G) Amplitude, plateau and tau of the exponential curve for various concentrations of the MKTAK group and the MK group. Horizontal bars represent mean, and error bars represent SEM, except for G, in which the error bars represent 95% confidence interval. *** indicates p < 0.001, and ** indicates p < 0.005. |
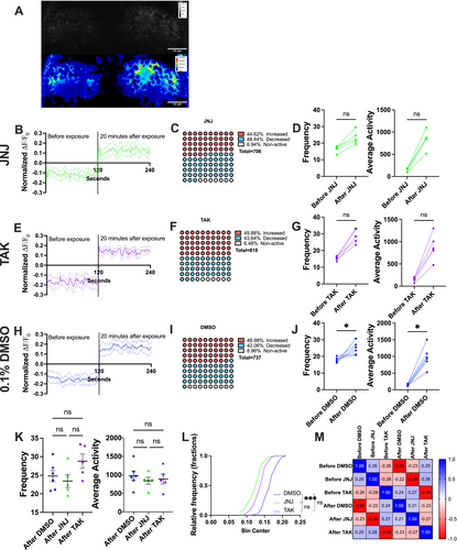
Spontaneous activity of habenula of larvae treated with GPR139 agonists. (A) Sample image of habenula in gray (top) extracted from maximum intensity projection and in color (bottom) extracted from sum slice projection. Scale bar indicated as 20 μM. (B, E, H) Normalized mean fluorescence intensity (ΔF/F0) of the JNJ (B), TAK (E), and the control (H) groups 120 s before compound exposure (pre-) and 20-min after exposure (post-). The vertical line indicated the separation of both conditions. Solid line was the mean value, and dashed lines were the SEM (C, F, and I) Percentage of the neurons with increased, decreased, and no change in fluorescence intensity in post-exposure condition compared to the mean value of fluorescence intensity in pre-exposure condition. (D, G, J) Mean frequency (left) and mean average activity (right) of pre- and post-eposure conditions and pairwise comparison with Wilcoxon test. (K) Mean frequency and mean average activity and Kruskal–Wallis test, followed by Dunn's multiple comparison test between JNJ, TAK, and the control groups. Mean in thick horizontal line and SEM in error bars were illustrated. (L) Cumulative distribution of fluorescence intensity in fractions in post-exposure condition and Kruskal–Wallis test with Dunn's multiple comparison test. (M) Correlation matrix of fluorescence intensity for JNJ, TAK, and the control in pre- and post-exposure conditions. * indicated p < 0.05, *** indicated p < 0.001, and ns indicated non-significant difference. |

Spontaneous activity of habenula of MK-801-induced larvae treated with GPR139 agonists. (A, B, D) Normalized mean fluorescence intensity (ΔF/F0) of GCaMP signals in the MK (A), MKJNJ (B), and MKTAK (D) groups 120 s before compound exposure and 20-min after exposure. The vertical line indicated the separation of both conditions. Solid line was the mean value, and dashed lines were the SEM (C and E) Percentage of the neurons with increased, decreased, and no change in fluorescence intensity in MK-801-induced condition (left) and 20 min after GPR139 agonists exposure, comparing to the mean value of fluorescence intensity in pre-exposure condition. (F and G) Pairwise comparison with Wilcoxon test on mean frequency and mean average activity of before and after MK-801 exposure (F, i, G i) and before and after JNJ-63533054 (F, ii) and TAK-041 (G, ii) exposure to MK-801-induced larvae. (H) Cumulative distribution of fluorescence intensity in fractions in post-exposure condition for MKJNJ (top) and MKTAK (bottom) and the Kruskal–Wallis test followed by Dunn's. (I) Correlation matrix of ΔF/F0 for MKJNJ, MKTAK, and the MK group in pre- and post-exposure conditions. * indicated p < 0.05, *** indicated p < 0.001, and ns indicated non-significant difference. |
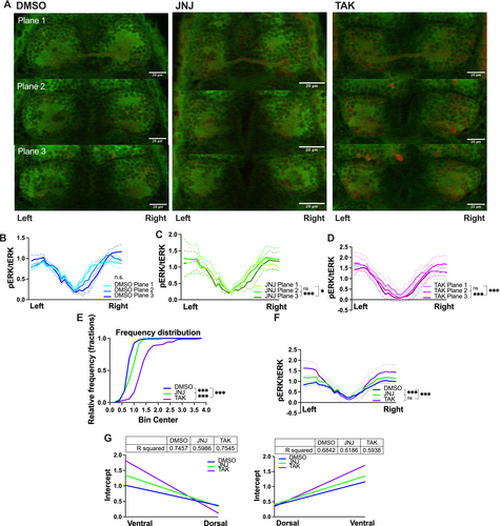
pERK (green)/tERK (red)-signals of normal larval zebrafish habenula after the startle habituation paradigm. (A) Sample illustration of three z planes separated by 7 μM for the control (left), JNJ (middle) and TAK (right) groups. White scale bar: 20 μM (B, C, D) pERK/tERK values of three planes arranged the ventral side of the left habenula (labeled as left) to the ventral side of the right habenula (labeled as right). (E) Cumulative distribution in fractions of pERK/tERK values of the control, JNJ and TAK groups. (F) Comparison of combined planes pERK/tERK between groups. (G) Linear regression for left habenula (left) and right habenula (right). Kruskal–Wallis test followed by Dunn's multiple comparison test were conducted. R squared of the fitted line were tabled. * indicated p < 0.05, *** indicated p < 0.001, and ns indicated non-significant difference. |
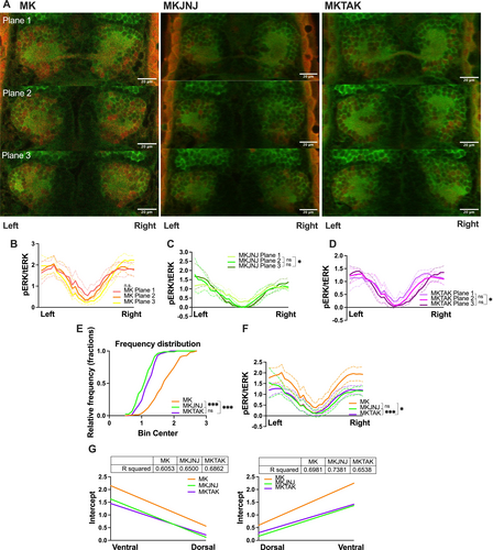
pERK (green)/tERK (red)-signals of MK-801-induced larval zebrafish habenula after the startle habituation paradigm. (A) Sample illustration of three z planes separated by 7 μM for the MK (left), MKJNJ (middle) and MKTAK (right) groups. White scale bar: 20 μM (B, C, D) pERK/tERK values of three planes arranged the ventral side of the left habenula (labeled as left) to the ventral side of the right habenula (labeled as right). (E) Cumulative distribution in fractions of pERK/tERK values of the MK, MKJNJ and MKTAK groups. (F) Comparison of combined planes pERK/tERK between groups. (G) Linear regression for left habenula (left) and right habenula (right). R squared of the fitted line were tabled. Kruskal–Wallis test followed by Dunn's multiple comparison test were conducted. * indicated p < 0.05, *** indicated p < 0.001, and ns indicated non-significant difference. |