FIGURE SUMMARY
Title

Bold zebrafish (Danio rerio) learn faster in a classical associative learning task

Authors
Corcoran, J., Storks, L., Wong, R.Y.
Source
Full text @ Sci. Rep.

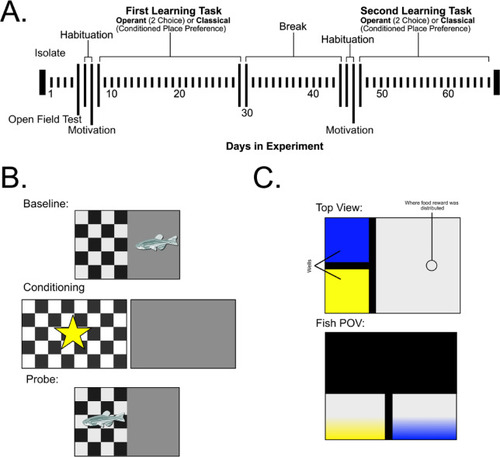
Overview of Experiment Timeline and Tasks. (
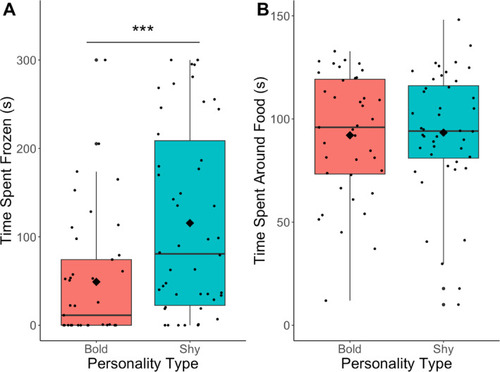
A) Top view and the fish point of view of the 2 choice discrimination task. The wells and where the food reward was distributed are labelled. (B) Brief overview of the stimulus displayed to the fish during the conditioned place preference task. The fish are initially presented the check and the grey stimulus. Whichever is least preferred is rewarded in conditioning trials, shown by the star symbol. Then the probe presents both stimuli to the fish and the preference is measured again. (C) Fish of all groups started with isolation on the first day and then went through an open field test (OFT), habituation, motivation test, and training on the first task (either conditioned place preference or 2-choice discrimination task). After a break fish went through habituation, motivation test, and the second task (whichever task was not completed first). The study design was counterbalanced where half of the fish began with the CPP task while the other half began with the 2-choice discrimination task.

(A) Boxplot of time spent frozen in the open field test. (B) Boxplot of time spent around the food in the motivation task. Bold fish are in red and shy fish are in teal. The diamond indicates the mean and the line is at the median. ***, p < .001.

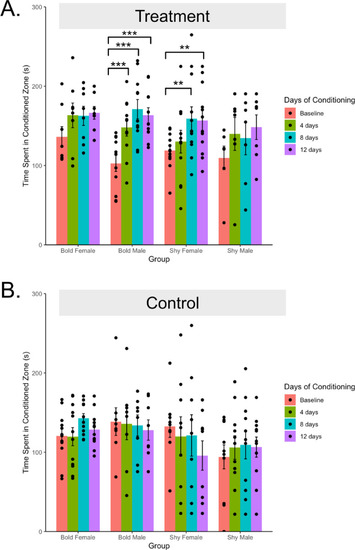
Time spent in the conditioned zone by group and day of conditioning in the CPP. (A) shows treatment fish and (B) shows control fish. Red bars are at baseline, blue bars are after 3 days of conditioning (Probe 1), green bars are after 7 days (Probe 2) and purple bars are after 11 days of conditioning (Probe 3). Error bars indicate standard error. p < .1, *p < .05, **p < .01, *** p < .001.

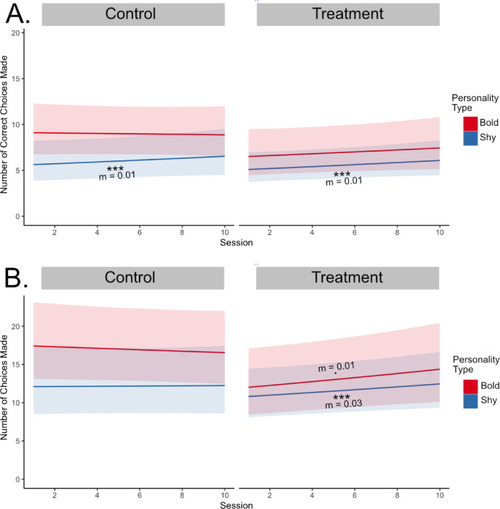
Regression lines of the number of choices made and number of correct choices made by personality type and treatment. (A) shows the regression lines for control and treatment fish for the number of correct choices made (B) shows regression lines for control and treatment fish for the number of choices made. The bold group is in red and the shy group is in blue. Shaded regions indicate a 95% confidence interval. ., p < .1; ***, p < .001.

Acknowledgments
This image is the copyrighted work of the attributed author or publisher, and ZFIN has permission only to display this image to its users. Additional permissions should be obtained from the applicable author or publisher of the image. Full text @ Sci. Rep.