FIGURE SUMMARY
Title

Analysis of the senescence secretome during zebrafish retina regeneration

Authors
Konar, G.J., Vallone, K.T., Nguyen, T.D., Patton, J.G.
Source
Full text @ Front Aging

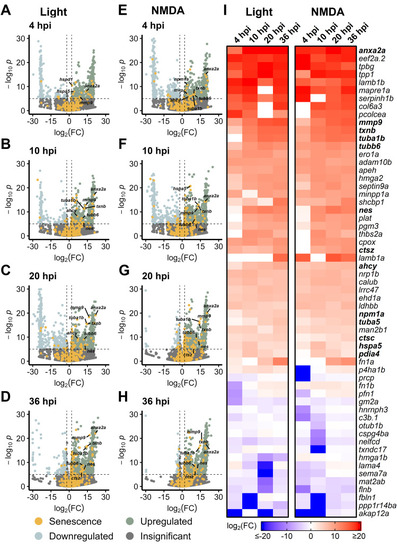
Differentially expressed SASP factors after acute light damage. Bulk RNAseq was performed on whole zebrafish retinas after acute light damage and compared to undamaged controls. (A–G) Volcano plots depicting up- and downregulated SASP factors and senescence markers at the indicated times post damage. Dashed lines represent values with a |log2FC| > 2 and p-values <10−6. Top significantly upregulated factors are labeled for each time point. (H) Heatmap showing enrichment of SASP factors at the indicated times post light damage. SASP factors and senescence markers were included in the heatmap if they had a log2FC > 3 with p-values <10−6 for at least one time point; bolded genes are part of the SASP-related Regeneration Factors (SRRFs).

Differentially expressed SASP factors after NMDA damage. Bulk RNAseq was performed on whole zebrafish retinas after intravitreal injections of NMDA and compared to undamaged controls. (A–C) Volcano plots showing differentially expressed SASP factors at the indicated times post damage. Dashed lines represent values with a |log2FC| > 2 and p-values <10−6. Top significantly upregulated factors are labeled for each time point. (D) Heatmap showing enrichment of SASP factors at the indicated times post NMDA damage. SASP factors were included in the heatmap if they had a log2FC > 3.5 with p-values <10−20 for at least one time point; bolded genes are part of the SRRF.

Gene Ontology (GO) analysis of differentially expressed SASP factors after light and NMDA damage. (A) GO analysis of the molecular function of the most enriched SASP factors in light damaged retinas showed enrichment for genes involved in the binding of integrins and fibronectin, as well as isomerase, peptidase, and chaperone function. (B) GO analysis of the molecular function of SASP factors in NMDA damaged retinas showed enrichment of genes responsible for lipase inhibitor activity, proteasome activation, and protein chaperone activity. SASP factors were included in the overrepresentation analysis if they had an adjusted p-value <0.05 and log2FC > 1. GO terms were included in each heatmap if they were enriched for at least two time points. Gray cells indicate time points at which the respective term was not enriched.

Upregulation of SASP factors in Müller glia after light and NMDA damage. Bulk RNAseq was performed on gfap+ Müller glia after either NMDA or light damage compared to undamaged controls. (A–D) Volcano plots showing differentially expressed SASP factors at the indicated times post light damage. (E–H) Volcano plots showing differentially expressed SASP factors at the indicated times post NMDA damage. Dashed lines represent values with a |log2FC| > 2 and p-values <10−6. Top significantly upregulated factors are labeled for each time point. (I) Heatmap showing enrichment of SASP factors at the indicated times post light or NMDA damage. SASP factors were included in the heatmap if they had a log2FC > 5 with p-values <10−6 for at least one time point; bolded genes are part of overlapping set of SRRFs.

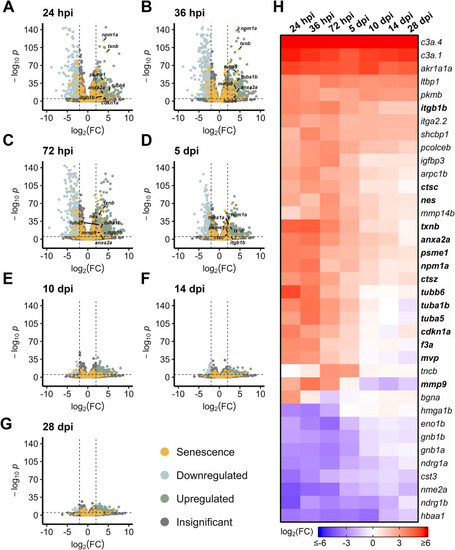
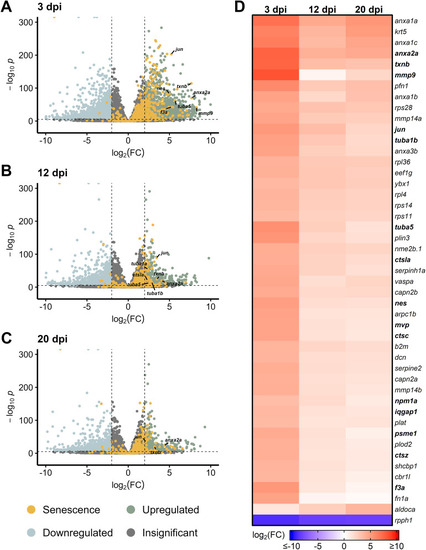
Differentially expressed SASP factors in genetic mutants with chronic photoreceptor damage. Bulk RNAseq was performed on whole zebrafish retinas from bbs2−/− and cep290−/− ciliopathy mutants. (A, B) Volcano plots of differentially expressed SASP factors in bbs2−/−or cep290−/− mutants at 6 mpf. Dashed lines represent values with a |log2FC| > 2 and p-values <10−6. Top significantly upregulated factors are labeled for each time point. (C) Heatmap showing differentially expressed SASP factors with a log2FC > 1.5 and p-values <10−6 in the indicated mutants; bolded genes are part of the overlapping set of SRRFs.

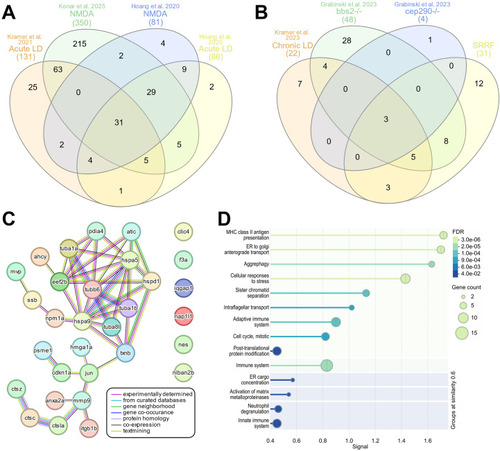
Regeneration specific secretome signature. InteractiVenn based analysis was used to determine the presence of a conserved secretome signature. (A) Analysis of upregulated SASP factors and senescence markers from 4 acute damage datasets identified 31 conserved genes, referred to as the SASP-related Regeneration Factors (SRRFs). (B) Analysis of upregulated SASP factors and senescence markers in chronic damage datasets identified 3 conserved genes. (C) STRING analysis of the SRRFs showed both predicted and conserved protein-protein relationships between 25 of the 31 genes in the SRRF. (D) Reactome analysis of the SRRFs showed enrichment in processes related to antigen presentation, cellular transport, immune system processing, and aggrephagy.

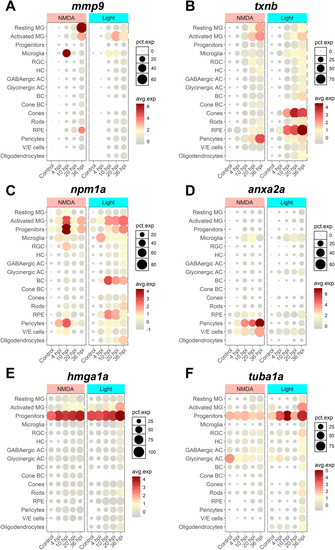
scRNAseq visualization of SASP factors after NMDA and light damage. Localization of SASP factor expression based on scRNAseq data from dissociated retinas was visualized using Seurat and the plot1cell package. (A)mmp9 expression was elevated in MG, microglia, and RPE. (B)txnb expression was elevated in MG and pericytes in both damage models, and cones and RPE in light damage only. (C)npm1a expression was elevated in MG, progenitors, microglia, pericytes, and bipolar cells. (D)anxa2a expression was elevated in microglia, pericytes, and vascular/endothelial cells. (E, F)hmga1a and tuba1a expression were largely elevated in progenitor cells. The average normalized expression within each cluster and the percentage of cells in each cluster expressing each gene of interest is shown. MG = Müller glia, RGC = retinal ganglion cell, HC = horizontal cell, AC = amacrine cell, BC = bipolar cell, RPE = retinal pigment epithelium, V/E cells = vascular endothelial cells.

Depletion of nucleophosmin 1a (npm1a) inhibits senescent cell accumulation and proliferation after NMDA damage. (A) Localization of npm1a expression by scRNAseq analysis after NMDA damage. (B) Depletion of npm1a by intravitreal injection of antisense oligonucleotides (ASOs). Control retinas were injected with either PBS or a mismatch control ASOs, and knockdown of npm1a was confirmed using qRT/PCR. (C) Depletion of npm1a inhibited accumulation and detection of senescent cells (SA-βgal+) at 3 dpi after NMDA damage. (D) Depletion of npm1a reduced detection of 4c4+ immune cells at 3 dpi after NMDA damage. (E, F) Depletion of npm1a in Tg[tuba1a.eGFP] zebrafish inhibited proliferation after NMDA damage at 3 dpi as measured by colocalization and counting of PCNA+/GFP+ MG-associated clusters in the Inner Nuclear Layer (INL) (n = 3–6, * = p < 0.05, ** = p < 0.01, *** = p < 0.001, **** = p < 0.0001).

Acknowledgments
This image is the copyrighted work of the attributed author or publisher, and ZFIN has permission only to display this image to its users. Additional permissions should be obtained from the applicable author or publisher of the image. Full text @ Front Aging