
- Title
-
In Vivo Measurement of Intestinal Permeability to Macromolecules in Adult Zebrafish (Danio rerio)
- Authors
- Meirelles, M.G., Fénero, C.I.M., Nornberg, B.F., Camara, N.O.S., Marins, L.F.
- Source
- Full text @ Zebrafish
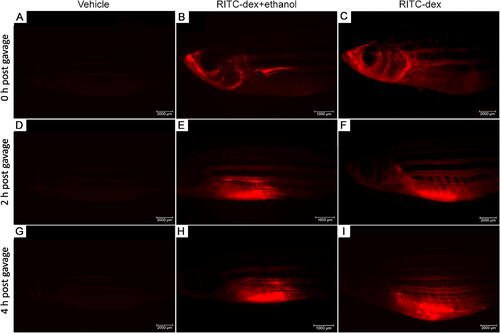
Dextran assay to access intestinal permeability in adult zebrafish (Danio rerio). In this assay, fish were gavaged with a 2% RITC-Dextran solution with a molecular weight of 10,000 Da. Representative images illustrate the transit of the fluorescent marker through the intestine for the negative control (vehicle; A-D-G; n = 7), positive control (RITC-dex + ethanol; B-E-H; n = 15), and test (RITC-dex; C-F-I; n = 15) groups. A–C: Images captured immediately postgavage. D–F: Images captured 2 h post-gavage. G–I: Images captured 4 h postgavage. We observed the presence of the labeled marker in the posterior intestine at 4 h postgavage in both the test and positive control groups. All images were acquired at excitation/emission wavelengths of 559–585 nm/600–690 nm and at a total magnification of 7×. Scale bar represents 1,000 µm and 2,000 µm. RITC, rhodamine B isothiocyanate. |
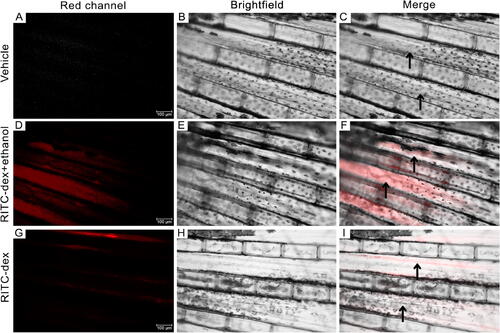
Dextran is released into bloodstream after gavage in adult zebrafish (Danio rerio). In this assay, fish were gavaged with a 2% RITC-Dextran solution with a molecular weight of 10,000 Da (n = 15). Representative images demonstrate an increase in fluorescence intensity within the vascular lumen (black arrows) of the caudal fin in the positive control group (RITC-dex + ethanol; D–F) compared with the test group (RITC-dex; G–I) at 2 h postgavage. Vehicle: Negative control. A, D, and G: Images were acquired using a fluorescent filter with excitation/emission wavelengths of 559–585 nm/600–690 nm. B, E, and H: Images were captured in the conventional channel. C, F, and I: composite images merging the two channels. All images were acquired using consistent magnification and exposure settings. Scale bar represents 100 µm. RITC, rhodamine B isothiocyanate. |

Dextran assay for epithelial barrier integrity in adult zebrafish (Danio rerio). Ex vivo fresh liver samples were obtained 4 h postgavage with a 2% RITC-Dextran (10,000 MW) solution from the negative control (Vehicles, A and B), test (C and D), and positive control (E and F) groups. Representative images reveal a higher fluorescent signal (depicted in red) in the liver of fish pre-gavaged with ethanol (F) compared with the test group (D). All images were captured using consistent magnification and exposure settings. The scale bar represents 500 µm. G: Quantitative fluorescence showing increased RITC uptake in the liver of positive control group relative to tested and negative control groups. Recovery of rhodamine B probe was measured using excitation wavelengths of 550 nm and emission wavelengths of 590 nm, using a Synergy H1® multimode plate reader. Each data point represents the normalized mean fluorescence quantification in the liver for an individual fish (n = 15 samples for the test group; n = 7 samples for the negative control; n = 13 samples for the positive control). Negative (1× PBS) and positive (25% ethanol) controls served as references for the assay. All analysis were carried out in triplicate. Statistical analysis was performed using a nonparametric one-way analysis of variance and Kruskal–Wallis multiple comparison test. Bars represent mean ± SEM. Different letters indicate significant differences (p < 0.05). PBS, phosphate-buffered saline; RITC, rhodamine B isothiocyanate; SEM, scanning electron microscopy. |