
|
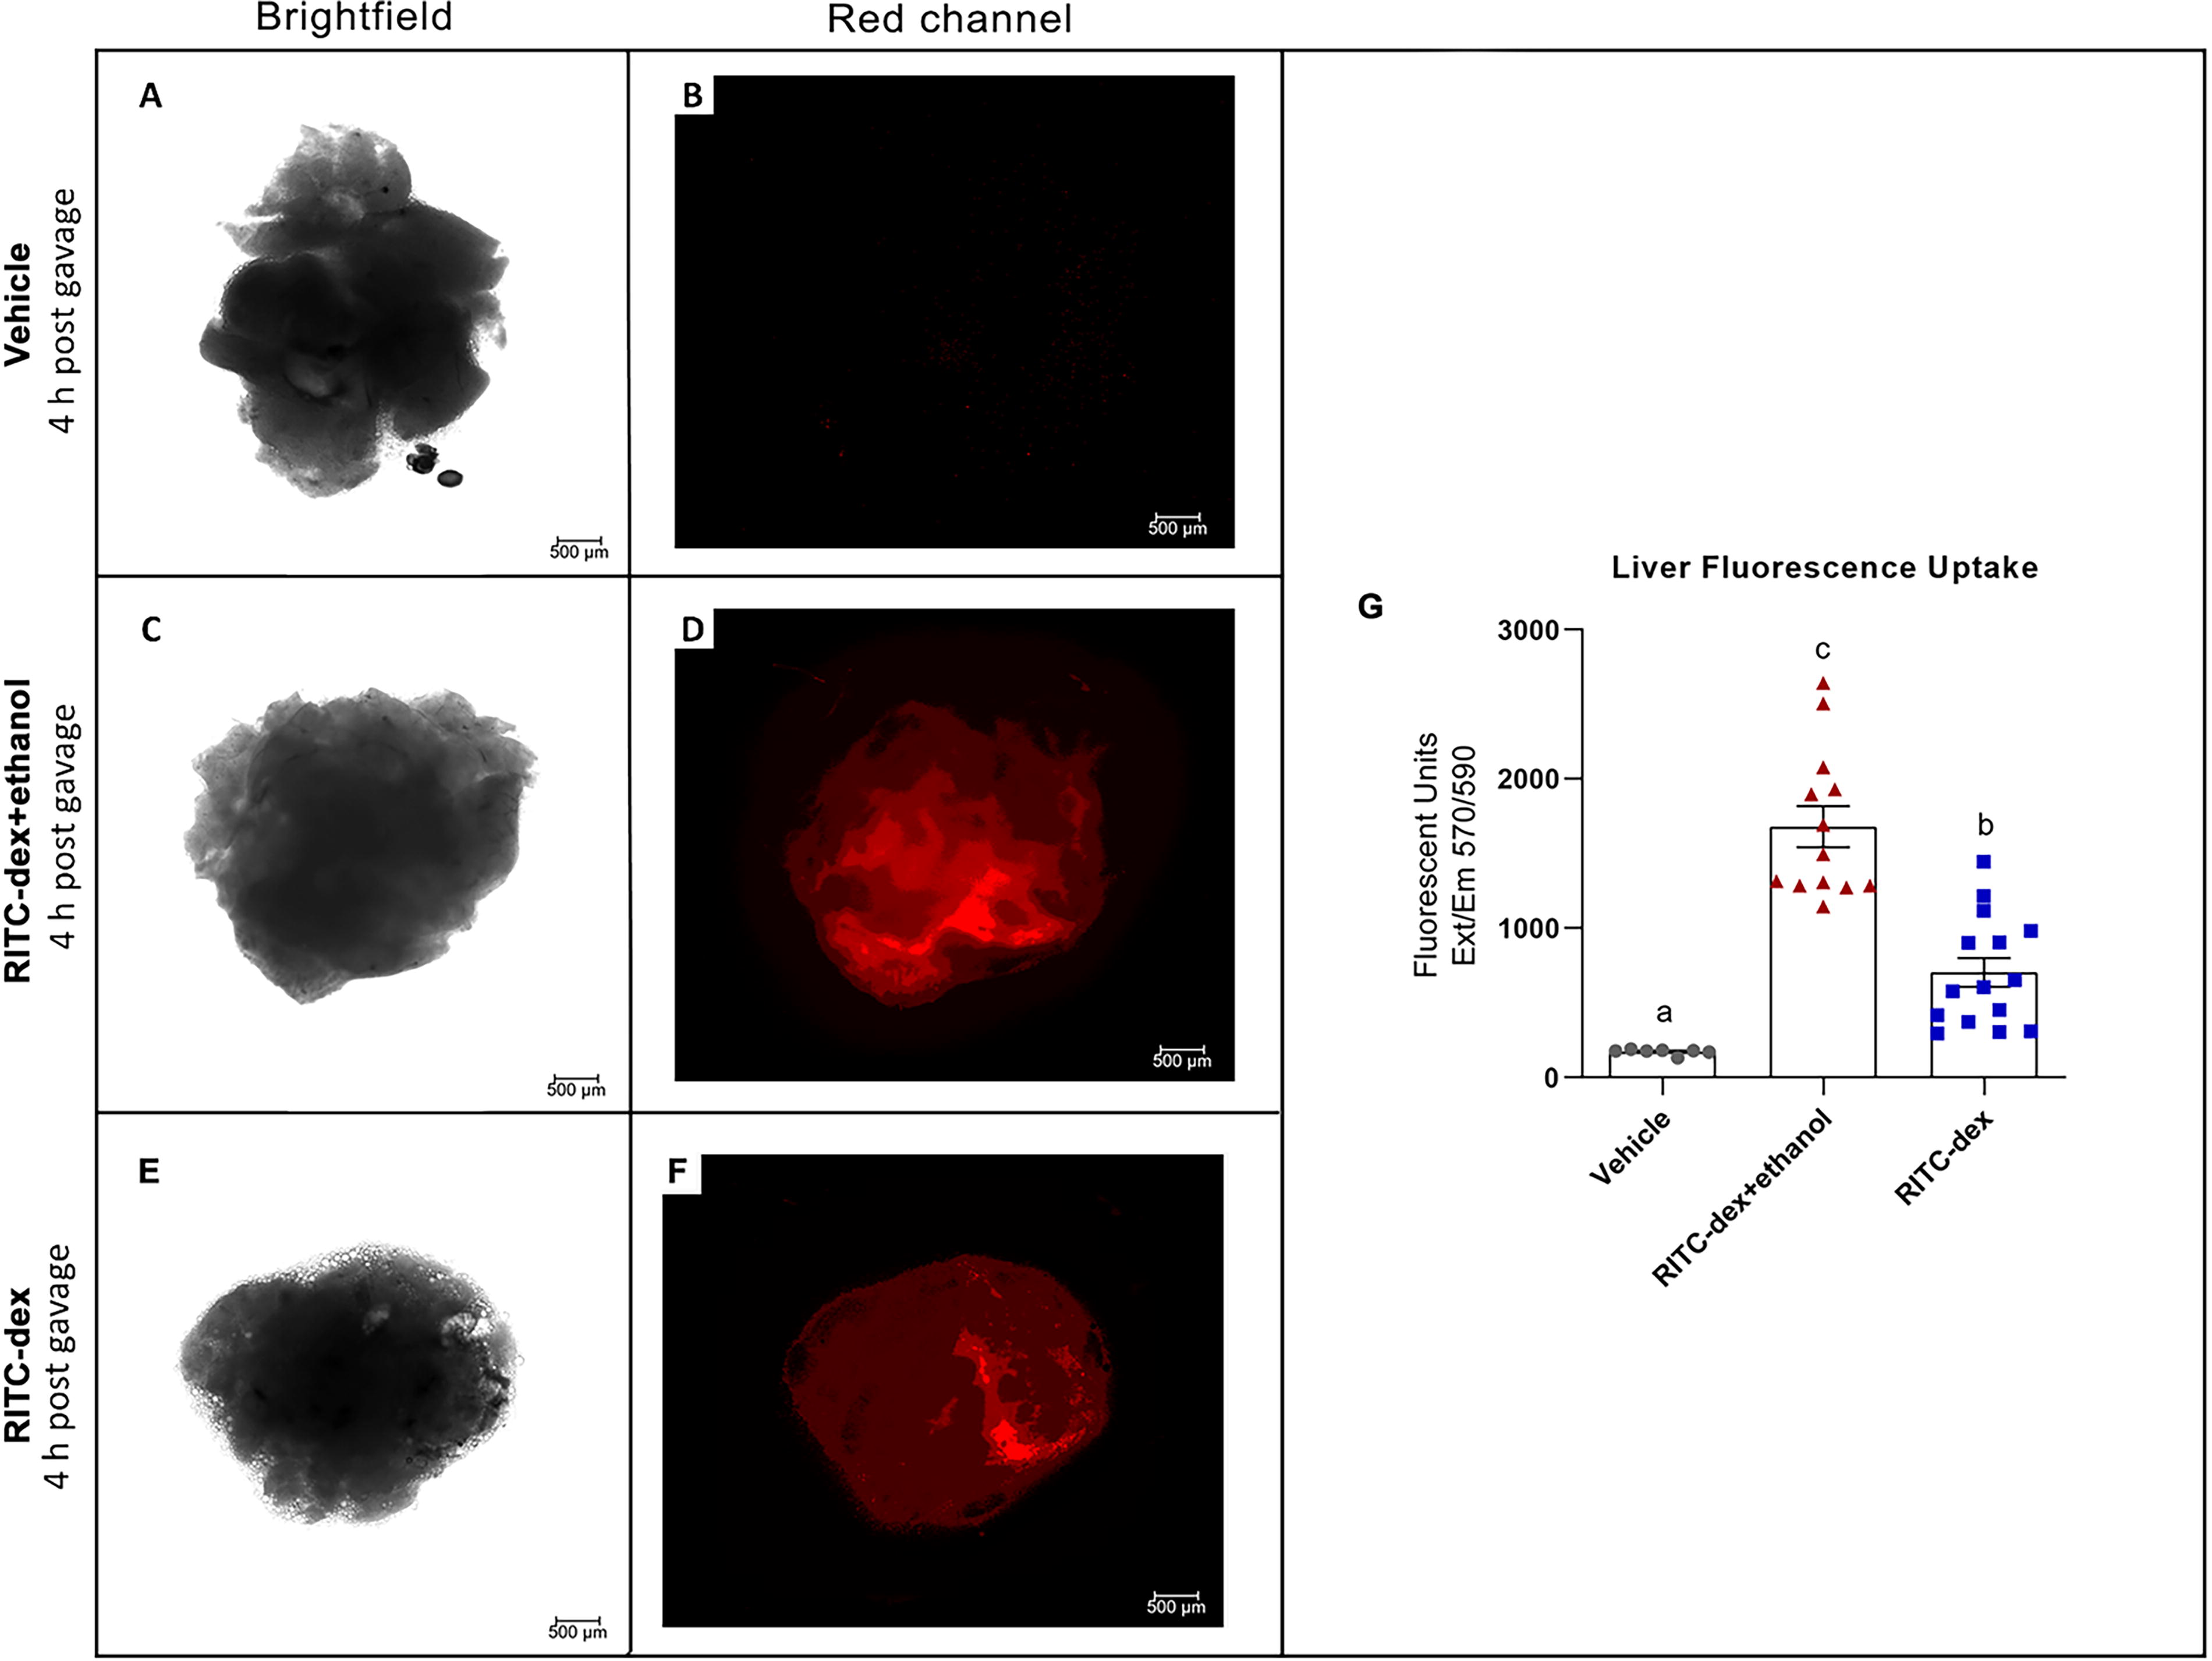
Fig. 3 Dextran assay for epithelial barrier integrity in adult zebrafish (Danio rerio). Ex vivo fresh liver samples were obtained 4 h postgavage with a 2% RITC-Dextran (10,000 MW) solution from the negative control (Vehicles, A and B), test (C and D), and positive control (E and F) groups. Representative images reveal a higher fluorescent signal (depicted in red) in the liver of fish pre-gavaged with ethanol (F) compared with the test group (D). All images were captured using consistent magnification and exposure settings. The scale bar represents 500 µm. G: Quantitative fluorescence showing increased RITC uptake in the liver of positive control group relative to tested and negative control groups. Recovery of rhodamine B probe was measured using excitation wavelengths of 550 nm and emission wavelengths of 590 nm, using a Synergy H1® multimode plate reader. Each data point represents the normalized mean fluorescence quantification in the liver for an individual fish (n = 15 samples for the test group; n = 7 samples for the negative control; n = 13 samples for the positive control). Negative (1× PBS) and positive (25% ethanol) controls served as references for the assay. All analysis were carried out in triplicate. Statistical analysis was performed using a nonparametric one-way analysis of variance and Kruskal–Wallis multiple comparison test. Bars represent mean ± SEM. Different letters indicate significant differences (p < 0.05). PBS, phosphate-buffered saline; RITC, rhodamine B isothiocyanate; SEM, scanning electron microscopy.